2026: Volume 5, Issue 1
Current Issue
 Abstract
  PDF
PDFEffect of Turmeric Powder Addition on the Quality and Colour Properties of Wheat Bread
Fayomi Oluwayomi1, Iorfa Sengev2, Dinnah Ahure2, Paul Ohini Ochelle2*
1Department of Food Science and Technology, College of Food Technology and Human Ecology, Joseph Sarwuan Tarka University, Makurdi, Nigeria
2Department of Food Science and Technology, Faculty of Renewable Natural Resources, Federal University, Dutsin-Ma, Katsina, Nigeria
*Corresponding author: Fayomi Oluwayomi, Department of Food Science and Technology, College of Food Technology and Human Ecology, Joseph Sarwuan Tarka University, Makurdi, Nigeria, Phone: +07039609634, E-mail: [email protected]
Received Date: September 25, 2025
Publication Date: March 17, 2026
Citation: Fayomi O, et al. (2026). Effect of Turmeric Powder Addition on the Quality and Colour Properties of Wheat Bread. Nutraceutical Res. 5(1):19.
Copyright: Fayomi O, et al. © (2026).
ABSTRACT
The addition effect of turmeric powder on the quality and colour properties of wheat bread was investigated. Bread samples were produced from blends of wheat with increasing level of turmeric powder at 0, 1.5, 3.0, 4.5 and 6.0 g addition where the 100 % wheat served as control. The functional properties of the composite blends of wheat and turmeric powder were determined. Also, the physical properties, proximate composition, mineral contents, anti-nutritional contents, colour properties and sensory attributes of the bread samples were determined using standard analytical procedures. The functional results obtained showed an increased water absorption capacity (0.90-1.67 g/g), swelling index (4.01-5.50 %), loose bulk density (0.83-2.19 g/cm3) and packed bulk density (2.81-3.49 g/cm3) with increased turmeric powder. Physical properties of the bread samples significantly (p<0.05) decreased in oven spring (0.50 to -1.50 cm), loaf volume (621.43- 473.19 cm3) moisture loss (12.07-2.33) and specific volume (3.39-2.38 cm3/g) but increased in loaf weight (183.3-199.5 g) with increased turmeric powder. The proximate composition of the bread samples showed significant (p<0.05) increase in moisture (23.78-30.83 %), ash (1.03-4.41 %), crude fibre (1.54-3.59 %), crude fat (8.61-8.98 %) and crude protein (11.90-15.74 %) but decreased carbohydrate (73.93-67.28 %) contents with increased turmeric powder. Energy values of the breads ranged from 412.86-432.77 kcal/100g. The result of the mineral analysis of the breads showed highly significant (p<0.05) increased values in all the mineral parameters but higher values were recorded in magnesium (145.65-182.80 mg/100g), calcium (252.39-343.68 mg/100g), phosphorus (75.10-133.4 mg/100g) and sodium (46.51-66.07 mg/100g) significantly (p<0.05) increased with increased turmeric powder while tannins, oxalate, phytate, cyanide and saponin ranged from 1.67-2.68 mg/100g, 2.81- 3.49 mg/100g, 4.01-5.50 mg/100g, 0.83-2.19 mg/100g and 0.90-1.67 mg/100g, respectively. The addition of turmeric powder resulted into a significant higher value of a* b* and YI at the crumb of the bread samples and a significant reduction of the lightness (L*) of the bread samples formulated with turmeric powder. Appearance and taste panel scores indicated that up to 3g addition of turmeric powder was acceptable in bread formulation. The study concluded that adding turmeric powder to wheat bread increased water absorption, nutrient and mineral contents, and altered color properties by enhancing redness and yellowness while reducing lightness. Higher turmeric levels reduced loaf volume but increased loaf weight. Sensory results showed bread with up to 3g turmeric was acceptable, while higher substitution levels were less preferred compared to 100% wheat bread, the control sample.
Keywords: Quality, Colour Properties, Turmeric, Bread, Sensory Properties.
INTRODUCTION
Bread, a staple food in many countries, is widely recognized for its nutritional significance. It provides a higher density of essential nutrients per gram compared to other individual food sources, such as meat, milk, potatoes, fruits, and vegetables [1]. In most European countries, it is the source of half of the total carbohydrate requirements, one-third of the protein requirements, and over 50 % of the B-vitamins and 75 % of thevitamin-E requirements [2]. It is a good source of macronutrients (carbohydrates, protein, and fat) and micronutrients (minerals and vitamins) that are all essential for human health [3]. These values make bread to be known as an essential food for human nutrition, and this has led all the countries throughout the world to study the composition of bread to improve its nutritive value and keeping quality [3].
In Nigeria, the popularity of bread is increasing in both urban and rural areas [4]. Consumption of leavened wheat bread has increased dramatically in developing countries like Nigeria because of changing food habits, increasing the working population outside the home, and urbanization. It is consumed extensively in most homes, restaurants, and hotels. The urban lifestyle is a more market dependent for foods such as bread with very limited capacity for home preparation [4].
For centuries, spices and herbs have been part of food items for the improvement of colour, aroma and flavour of food items and as functioning agents for their anti-oxidative, preservative and antimicrobial effect [5]. Several researchers [6,7] have over the years attempted the utilization of oils and extracts of many herbsand spices for improving shelf life of foods and to use it as alternative for food preservatives. Industrialists and food researchers are trying to improvise the quality, standard, safety and variety of food products including bread because modern day consumers choose to use safer foods in order to save themselves from being victims of numerous non-communicable illnesses. For this purpose, there is need for an inclusion of natural spices and herbs such as turmeric as optional ingredients in food product formulations [8].
Turmeric plants (Curucma longa; family Zingiberaceae) are cultivated for its rhizome in majority of the tropical regions, to be used as a flavouring agent [9]. Turmeric rhizome has been proven to possess rich therapeutic potential and are traditionally (routinely) used in Indian cuisine as well as in other Asian foods as a spice (flavouring agent), as a natural preservative, as well as for imparting colour to the food due to its wonderful yellow colour. The taste of turmeric is described as peppery and imprecisely bitter [9,10]. Several research studies have been reported on the prospective culinary and therapeutic uses of turmeric rhizome [11]. The study of Enemor et al. [9] on the proximate composition of dried rhizome of turmeric indicated moisture content of 9.55 %, carbohydrate (57.30 %), ash (24.70 %), crude fibre (1.12 %), proteins (2.15 %) and fat (5.32 %). Mineral composition analyses showed that C. longa rhizomes had higher contents of calcium, magnesium, potassium and sodium in parts per million (ppm) at 38.68, 19.75, 9.20 and 7.06, respectively. Amino acid profile revealed the presence of both essential and non-essential acid with aspartate and glutamate in higher contents at 9.78 g/100 g and 9.65 g/100 g, respectively. The presence of vitamins A, C and D at 254.5 mg/kg, 19.47 mg/kg and 10.92 mg/kg, respectively were also observed Enemor et al. [9].
Turmeric has extremely acclaimed good source of functional food constituents due to its Curcumin content which has several health improving benefits and its antimycotic and antioxidative activities have been reported in butter cake by [12]. Curcuminoids of turmeric have high stability and the level of any cucuminoid is not affected by heating [12]. However, further research is needed to support turmeric flour as part of our food formulations.
Wheat flour, which is the primary ingredient in bread production, it is known for its limited mineral contents, with an ash content of only 0.53% [13]. This deficiency results in bread products that lack essential minerals necessary for optimal growth and development. Furthermore, conventional wheat bread often falls short in terms of functional health benefits, as it contains limited bioactive compounds and antioxidants. Turmeric powder, a natural spice rich in curcumin and known for its vibrant yellow colour, offers significant potential for enhancing both the nutritional and sensory properties of bread. It is an excellent source of bioactive compounds with antioxidant, anti-inflammatory, and antimicrobial properties [14]. However, incorporating turmeric into bread requires a systematic evaluation of its effects on the quality attributes, including colour, texture, flavor, and overall consumer acceptability. Despite the growing interest in functional foods, there is a lack of sufficient research exploring the fortification of wheat bread with turmeric powder and its implications for improving the nutritional profile and functional properties of bread. This gap underscores the need for a study that evaluates how turmeric powder addition can enhance the mineral content and sensory qualities of wheat bread while maintaining its structural integrity.
Bread is a staple food consumed globally and represents a practical medium for nutritional enrichment due to its widespread acceptance. Despite its popularity, wheat bread is nutritionally limited, particularly in its mineral content, which is essential for proper growth and development [13]. Addressing these nutritional gaps in wheat bread through the incorporation of functional ingredients is an emerging area of interest in food science. Turmeric powder, a natural and readily available ingredient, is known for its distinct yellow color and nutritional benefits, including its rich mineral profile [14]. Its incorporation into wheat bread could not only improve the bread's mineral composition but also enhance its color properties, offering a natural alternative to synthetic food colorants. With increasing consumer preference for visually appealing and naturally enriched foods, turmeric presents a promising opportunity to innovate traditional wheat bread formulations.
MATERIALS AND METHODS
Materials Procurement
Wheat flour, butter, sugar, salt and yeast were purchased from North-bank Market, Makurdi, Benue State. Fresh turmerics were purchased from fruit Market, Makurdi and were taken to the Department of Food Science and Technology, Joseph Sarwuan Tarka University, Makurdi for further processing.
Preparation of Turmeric Powder
Turmeric rhizomes (C. Longa L.) were processed into powder according to method described by Park [15]. The turmeric roots were washed, cleaned, cut into small pieces, dried using forced air-drying oven at a modified temperature of 40 oC for 48 h, ground to a powder form using a blender and passed through a 0.5 mm sieve. The process is outlined in Figure 1.
Blends with different proportions of wheat and turmeric powder were prepared as shown in Table 1.
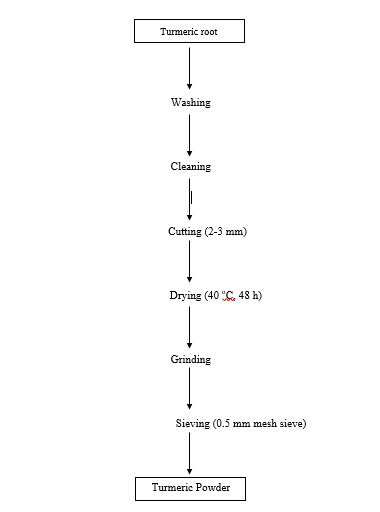
Figure 1: Production of Turmeric Flour (Source: Modified method of Park [15]).
Table 1: Blend Formulation for the Production of Breads from Wheat Flour and Turmeric Powder Blends
|
Ingredient (g) |
|
|
Wheat Flour |
Turmeric Powder |
|
100 |
0 |
|
100 |
1.5 |
|
100 |
3 |
|
100 |
4.5 |
|
100 |
6 |
Key
A = (Control) 100 g wheat flour
B = 100 g wheat flour + 1.5 g turmeric powder
C = 100 g wheat flour + 3.0 g turmeric powder
D = 100 g wheat flour + 4.5 g turmeric powder
E = 100 g wheat flour + 6.0 g turmeric powder
Table 2: Recipe Formulation for Bread
|
Component |
Bread Composition (g) |
|
Flour* |
100 |
|
Butter |
3 |
|
Sugar |
5 |
|
Salt |
0.5 |
|
Yeast |
2.5 |
|
Water |
70 (mL) |
*Wheat or Composite Flour
Preparation of Bread from Wheat Flour and Turmeric Powder Blends
Breads were produced from the composite of wheat flour and turmeric powder based on the recipe formulation shown in Table 2. The breads were baked in accordance with the modified method of Joseph et al. [16]. The composite flour, butter, sugar, yeast, salt and other baking ingredients with water after scaling were manually mixed together in a bowl. The mixtures were kneaded using the kneading machine until the dough was developed then moulded and allowed to proof in pans for an hour. The doughs were baked at a modified temperature and time (250 oC for 45 mins) in the oven and were allowed to cool then packaged for further analyses. The production of wheat and turmeric composite bread is shown in Figure 2.
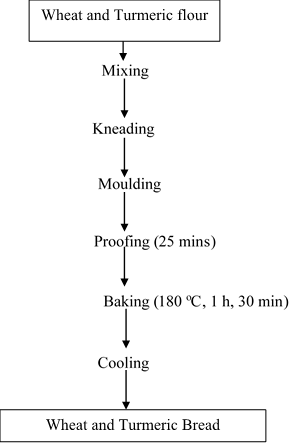
Figure 2: Production of Wheat flour and Turmeric Powder Bread (Source: Joseph et al. [16] with modification).
The method described by Onwuka [17] was used. One (1 g) of the flour sample was weighed into a 15 mL centrifuge tube and suspended in 10 mL of water. It was shaken on a platform tube rocker for 1 minute at room temperature. The sample was allowed to stand for 30 min and centrifuged (Model SM 800B Uniscope Surgifriends Medicals, England) at 500 rpm for 30 min. The volume of free water was read directly from the centrifuge tube. Density of water was taken to be 1 g/cm3.

Loose bulk density and packed bulk density (g/ mL)
Loose bulk density of the flour samples was determined by the gravimetric method described by Kakar et al. [18]. A weighed sample (10g) was put in a calibrated 25 mL measuring cylinder and the volume was recorded as the loose volume. The bottom of the cylinder was tapped repeatedly on a firm pad on a laboratory bench until a constant volume was observed. The packed volume was recorded. The loose bulk density (LBD) and packed bulk densities (PBD) was calculated as the ratio of the sample weight to the volume occupied by the sample before and after tapping.

Where
pb = Bulk density
M = Weight of powder
V = Volume of powder
Swelling capacity (%)
The swelling capacity % of the flour determined based on method described by Kakar et al. [18]. One gram of the sample was transferred into a weighed graduated 50 mL centrifuge tube. Distilled water added to give a total volume of 40 mL. The suspension stirred uniformly with a stirrer avoiding excessive speed, in other not to cause fragmentation of the starch granules. The sample heated at 85°C in a thermostatically regulated temperature bath (Grant instruments, England Ltd.) for 30 min with constant stirring. The tube was removed, wiped dry on the outside and cooled to room temperature, then centrifuged for 15 min at 560 g (Mistral 3000i, UK). The solubility determined by evaporating the supernatant in a hot air oven (BS Gallen Kamp, England) and the residue weighed. The swelling volume was obtained by directly reading the volume of the swollen sediment in the tube. The sediment paste weighed. The swelling capacity % determine by formula.

Determination of the Proximate Composition of Wheat and Turmeric Powder Bread
The proximate composition of bread from composite of wheat flour and turmeric powder was determined according to the methods of AOAC [19] and Carbohydrate content was determined by difference according to Ihekoronye and Ngoddy [20].
Moisture content determination
Moisture content was determined using the air oven dry method described by AOAC [19]. A clean dish with a lid was dried in an oven at 100 0C for 30 min. It was cooled in desiccators and weighed. Two (2) grams of sample was then weighed into the dish. The dish with its content was then put in the oven at 105 0C and dried to a fairly constant weight. The loss in weight from the original sample (before heating) was reported as percentage moisture.

Where: W1=weight of empty crucible, W2= weight of crucible+sample before ashing, W3= weight of crucible+content after ashing
Ash Content Determination
AOAC [20] was used in determining the ash content of the bread samples. Two (2) gram of sample was weighed into an ashing dish which had been pre-heated, cooled in a desiccator and weighed soon after reaching room temperature. The crucible and content were then heated in a muffle furnace at 550 oC for 6 h. The dish was cooled in a desiccator and weighed soon after reaching room temperature. The total ash was calculated as percentage of the original sample weight.

Where: W1=weight of empty crucible, W2= weight of crucible+sample before ashing, W3= weight of crucible+content after ashing
Crude Fibre Determination
Method described by AOAC [19] was used to determined crude fibre content of the bead samples. Two (2) grams of the sample was extracted using Diethyl ether. This was digested and filtered through the California Buchner system. The resulting residue was dried at 130 0C for 2 hrs., cooled in a dessicator and weighed. The residue was then transferred into a muffle furnace and ignited at 550 0C for 30 min, cooled and weighed. The percentage crude fibre content was calculated as:

Crude Fat Determination
Fat was determined using Soxhlet method described by AOAC [19]. Samples were weighed into a thimble and loose plug fat free cotton wool were fitted into the top of the thimble with its content inserted into the bottom extractor of the Soxhlet apparatus. Flat bottom flask (250 mL) of known weight containing 200 mL of hexane was fitted to the extractor. The apparatus was heated and fat extracted for 8 hrs. The solvent was recovered and the flask (containing oil and solvent mixture) were transferred into a hot air oven at 105 oC for 1 hr to remove the residual moisture and to evaporate the solvent. It was later transferred into desiccator to cool for 15 min before weighing. Percentage fat content was calculated as

Crude protein determination
The Kjeldahl method recommended by AOAC [19] was used to determine the percentage crude protein. Exactly, two (2) grams of sample was weighed into a Kjeldahl digestion flask using a digital weighing balance. A catalyst mixture weighing 0.88 g (96 % anhydrous sodium sulphate, 3.5 % copper sulphate and 0.5 % selenium dioxide) was added. Concentrated sulphuric acid (7 mL) was added and swirled to mix content. The Kjeldahl flask was heated gently in an inclined position in the fume chamber until no particles of the sample was adhered to the side of flask. The solution was heated more strongly to make the liquid boil with intermittent shaking of the flask until clear solution was obtained. The solution was allowed to cool and diluted to 25 mL with distilled water in a volumetric flask. Ten (10) mL of diluted digest was transferred into a steam distillation apparatus. The digest was made alkaline with 8 mL of 40 % NaOH. To the receiving flask, 5 mL of 2 % boric acid solution was added and 3 drops of mixed indicator was dropped. The distillation apparatus was connected to the receiving flask with the delivery tube dipped into the 100 mL conical flask and titrated with 0.01 HCl. A blank titration was done. The percentage nitrogen was calculated from the formula:

Where S = sample titre, B = blank titre, S-B = corrected titre, D=diluted factor % Crude Protein=% Nitrogen ×6.25 (conversion factor)
Carbohydrate determination Carbohydrate content was determined by difference according to Ihekoronye and Ngoddy [20] as follows % Carbohydrate =100-(% Moisture + % Ash + % Fibre +% Fa t+ % Protein) [9].
Energy content (kcal/100g) determination The values obtained for protein, fat and carbohydrate were used to calculate the energy content value of the samples. The proportion of protein, fat and carbohydrate were multiplied by their physiological fuel values of 4, 9 and 4 kcal/100g, respectively and the sum of the product was taken [22].
Protein content (%)=P Fat content (%)=F Carbohydrate content (%)=C

Determination of the Physical Characteristics of Bread
Determination of oven spring
Oven spring of the loaves was determined according to the method of Onwordi et al. [22]. The dough height was measured before baking using a straight edge metric rule and height was measured again after baking. The difference in height equals the oven spring.
Oven Spring (cm) = Height after baking-Height before baking (11)
Determination of loaf volume was by seed displacement method as described by the modified bof Cotovanu and Mironeasa [23]. A container (126.44 g) of fixed dimensions (18 cm3 × 12.7 cm3 × 12.4 cm3) of internal volume 2834 cm3 was filled with rice grain; a straight edge ruler was used to cut off all grains above the container rim. The grains were poured out and weighed (W1). A weighed loaf was placed in the container and the weighed seeds were used to fill the container and levelled off as before. The overspill was weighed (W2) and from the weight obtained, volume of rice displaced by the loaf was calculated using the following equation.
Determination of loaf volume was by seed displacement method as described by the modified bof Cotovanu and Mironeasa [23]. A container (126.44 g) of fixed dimensions (18 cm3 × 12.7 cm3 × 12.4 cm3) of internal volume 2834 cm3 was filled with rice grain; a straight edge ruler was used to cut off all grains above the container rim. The grains were poured out and weighed (W1). A weighed loaf was placed in the container and the weighed seeds were used to fill the container and levelled off as before. The overspill was weighed (W2) and from the weight obtained, volume of rice displaced by the loaf was calculated using the following equation.

W1 = Weight of rice grains that filled the container W2 = Weight of rice grains displaced by the loaf samples
Determination of loaf weight The bread samples were weighed (g) using a weigh balance (model: Sliding Harvard Trip balance, 2 kg-51 b capacity) as described by Onwordi et al. [23].
Determination of specific volume The specific loaf volume was determined by dividing the loaf volume by its corresponding loaf weight (cm3/g) as described by Araki et al. [24]. The specific volume is the ratio between loaf volume and loaf weight expressed in cubic centimetre per gram.
The bread samples were weighed (g) using a weigh balance (model: Sliding Harvard Trip balance, 2 kg-51 b capacity) as described by Onwordi et al. [23].
Determination of specific volume
The specific loaf volume was determined by dividing the loaf volume by its corresponding loaf weight (cm3/g) as described by Araki et al. [24]. The specific volume is the ratio between loaf volume and loaf weight expressed in cubic centimetre per gram.

Colour Determination (L*, a* and b* Values)
L, a and b parameters were determined using a colourimeter (Minolta Chroma Meter (CR200, Minolta, Japan). In detail, it assessed the following colour traits: L (lightness) axis – 0 is black, while 100 is white; a (red-green) axis – positive values are yellow, while negative values are blue and 0 is neutral. Multiple measurements (triplicate) of L*, a* and b* parameters were determined using the colourimeter on the sample. From the data obtained, deltachroma (∆C), colour intensity (∆E), hue angle and degree of whiteness were calculated according to equations 1, 2, 3 and 4, respectively [25].
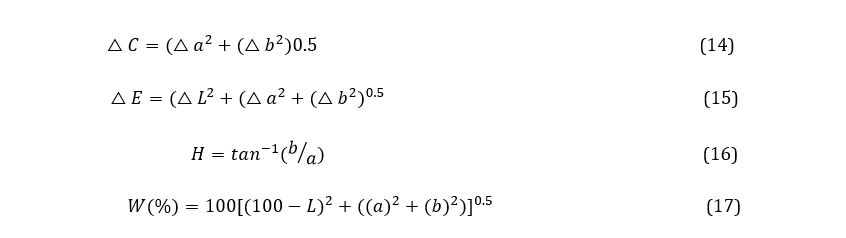
Note: W is the degree of whiteness of the sample
Sensory Evaluation of Bread
Sensory evaluation of the bread samples was carried out according to the method described by Ochelle et al. [26]. A panel of thirty [30] members consisting of students and members of staff from the Department of Food Science and Technology, Joseph Sarwuan Tarka University, Makurdi, Nigeria was selected based on their familiarity and experience with wheat based breads for sensory evaluation. Breads produced from each flour blend, along with the reference sample were presented in coded form and were randomly presented to the panellists. The panellists were provided with potable water to rinse their mouth between evaluations. A questionnaire describing the quality attributes (crumb appearance, taste, aroma, crumb texture and overall acceptability) of the bread samples was given to each panellist. Each sensory attribute was rated on a 9-point Hedonic scale (1 = dislike extremely and 9 = like extremely).
Statistical Analysis
Data obtained were subjected to analysis of variance (ANOVA) and means were separated using Duncans multiple range test (D M R T) with significance difference tested at 5 % level of probability.
RESULTS AND DISCUSSION
Effect of Turmeric on the Functional Properties of Wheat-Turmeric Composite Flour
Table 3 shows the effect of turmeric powder addition on the functional properties of wheat-turmeric dough. Generally, the result showed a significant difference in the functional parameters of the wheat-turmeric dough. The water absorption capacity (71.00-81.33 %), swelling capacity (4.01- 5.50 %), loose bulk density (0.43-0.48 %) and packed bulk density (0.71-0.85 %) increased progressively with increased level of turmeric powder addition.
Functional properties of a food material are parameters that determine its application and end use [27]. They are those physico-chemical properties of food proteins that determine their behaviour in food system during processing, storage and consumption. It usually shows that the food materials under investigation will interact with other food components directly o indirectly affecting processing applications, food quality, and ultimate acceptance [28].
Water absorption capacity is the ability of product to incorporate water and water inhibition is an important functional trait in food such as sausages, custard and dough [29]. It also refers to water retained by a food product following filtration and application of mild pressure of centrifugation [30]. The increment in water absorption capacities may be attributed to the high carbohydrate contents recorded in 100 % wheat bread, as carbohydrates have been reported to greatly influence the water absorption capacity of foods [31]. Also, wheat flour and turmeric powder may have contained more hydrophilic constituents which gave rise to higher water absorption capacity of the composite flours [32]. The lower moisture content in wheat bread flour may have contributed to its higher water absorption capacity, as flour with lower initial moisture content tends to absorb more water during mixing and processing [32]. Water absorption of flours is dependent mainly on the amount and nature of the hydrophilic constituents and to some extent, on pH and nature of the protein [33]. It has been suggested that flours with high water absorption capacity as seen in this study will be very useful in bakery products and this could prevent staling by reducing moisture loss [34] and also, help maintain the freshness of bread, cakes and sausages and could favour their use as soup thickener [30]. WAC is important in foods where water will be absorbed without dissolution of protein, thus increasing their viscosity and body thickening [35]. Thus, this implies that the addition of turmeric powder improves the reconstitution ability.
The results of both loose and packed bulk densities are used to evaluate flour heaviness, handling requirements, and the type of packaging materials suitable for storage and transportation of food materials [36]. These findings suggest that flour samples may require different packaging spaces and materials. Bulk density reflects the load the samples can carry when allowed to rest directly on one another [37]. The loose and packed bulk densities of the composite flours increased as the incorporation level of turmeric powder increased, indicating that turmeric powder contributes to densification. Similar trends in bulk density increases have been reported for composite flours enriched with natural additives, such as turmeric and pumpkin powder, which contribute hydrophilic and structural components [38]. Generally, the bulk density of food materials is affected by the particle size and the density of the food. It is therefore an important factor in food packaging [39]. Also, it has been reported that bulk density is influenced by the structure of the starch polymers and loose structure of the starch polymers could result in low bulk density [40]. Low bulk density of flour as observed in this study is a good physical attribute when determining transportation and storability [41]. Low bulk density is also important in infant feeding where less bulk is desirable. However, the higher bulk density of the flours would be a disadvantage in the use of the flour for preparation of complementary foods [32,42]. The range of bulk density obtained in this study is higher than 0.586 – 0.693 g/mL and 0.86 – 0.72 g/cm3 obtained for wheat – pigeon pea blends by Arukwe [43] and wheat and acha by Ubbor et al. [42], respectively.
The result of the swelling index as shown in Table 3 indicated that addition of turmeric powder significantly increased the swelling index of the flour samples. Swelling capacity is a function of process conditions, nature of material and type of treatment. The high swelling capacity could be an advantage in production of bakery products. The highest value of swelling index recorded for the composite flours indicates that the flours possess higher starch content than other flour samples [44], and can be used for the formulation of variable products [42]. The result of the increasing trends of functional properties of wheat-turmeric flour presented in this study is similar to that reported by Lim et al. [45] in their study on the quality and antioxidant properties of bread containing turmeric cultivated in South Korea.
Effect of Turmeric on the Physical Properties of Wheat-Turmeric Based Bread
Table 4 presents the physical properties of bread products formulated from blends of wheat and turmeric powder composite flour. There was significant difference in the physical properties of the formulated breads from wheat and turmeric powder. The oven spring, loaf volume, moisture loss and specific volume of the bread samples decreased progressively from 0.50 to -1.50 cm, 621.43- 473.19 cm3, 12.07-2.33 and 3.39-2.38 cm3/g in the control sample and in the 100:6.0 g wheat and turmeric powder bread respectively with increased level of turmeric powder substitution. The loaf weight increased with increased level of turmeric powder addition and it ranged from 183.3-199.5 g in 100:0g wheat bread and 100:6.0 g wheat and turmeric powder bread respectively.
Physical properties are properties that can be measured or observed without changing the chemical nature of the substance. The dilution effect on gluten was the reason for the observed decrease in oven spring, loaf volume and specific volume with increased turmeric powder addition. The gluten fraction is responsible for the elasticity of the dough by causing it to extend and trap the carbon dioxide generated by yeast during fermentation. When gluten coagulates under the influence of heat during baking, it serves as the framework of the loaf, which becomes relatively rigid and does not collapse [46]. The decrease is also attributed to the lower levels of gluten network in the composite doughs and consequently, less ability of the dough to rise due to weaker cell wall structure [47]. According to Yusnita and Wong [48], addition of dietary fibre rich substances in baking products reduce loaf volume. It is ultimate that bread samples with reduced volume will also have reduced specific volume [49]. The observed increase in weight of composite bread samples with increased turmeric powder is as a result of less retention of carbon-dioxide gas in the blended dough, hence providing dense bread texture. Also, the higher moisture contents of the composite flour could have contributed to the higher loaf weight relative to 100 % wheat bread [50]. The results of this study are in- line with the findings of Sengev et al. [51]; Igbabul et al. [52] and Ufot and Inemesit [50], who reported increased bread loaf weight but decreased oven spring, loaf volume and specific volume with the increased substitution of wheat flour with sweet potato, maize/orange fleshed sweet potato and unripe plantain, respectively.
Effect of Turmeric Powder on the Proximate Composition (%) of Wheat Based Bread
The proximate composition of wheat and turmeric powder breads is presented in Table 5. The moisture, ash, fibre, fat and protein contents increased progressively with increased level of turmeric powder substitution while the carbohydrate contents and energy values showed decreased values with an increased level of turmeric powder substitution. Differences in the proximate contents of the bread from various flour blends were significantly. The moisture, ash, crude fibre, crude fat and protein contents ranged from 23.78-30.83 %, 1.03-4.41 %, 1.54-3.59 %, 8.61-8.98 5 and 14-90-15.74 % in the 100 % wheat bread and 100:6.0g wheat and turmeric powder composite breads respectively. The carbohydrate contents decreased from 73.93 % to 67.28 % with increased level of turmeric powder addition. Differences in the carbohydrate contents of the various blends were significant (p < 0.05). The energy values of the wheat-turmeric powder bread decreased from 432.77 kcal/100g – 412.86 kcal/100g for the control sample and the 100:6 g wheat: turmeric powder bread respectively. The differences in the energy values across the five samples were significantly different. The lowest energy value was recorded in the 100:6.0 g wheat and turmeric powder bread (412.86 kcal/100g).
The increase in the moisture content could be attributed to the greater water holding capacity of the composite flours as seen from the water absorption capacity of flour samples. This trend is similar to the findings reported by Amandikwa et al. [53]; Ufot and Inemesit [50]; Ochelle et al. [54] Ayo et al. [58] for wheat-yam flour composite breads, wheat-unripe plantain, wheat-water yam, and soybean, respectively.
The ash contents of the bread samples increased significantly with increased levels of turmeric powder. Ash content gives an insight to the mineral content of food; hence, turmeric can be described as a good source of minerals hence the relatively high-value of minerals recorded in the wheat and turmeric composite breads. The results obtained in this study are in agreement with the work of Abdellatif et al. [55].
Table 3: Effect of Turmeric Addition on the Functional Properties of Wheat-Turmeric Flour
|
Sample |
WAC |
SC |
LBD |
PBD |
|
|
(%) |
(%) |
(%) |
(%) |
|
A |
c |
e |
c |
d |
|
71.00±3.46 |
4.01±3.21 |
0.43±0.03 |
0.71±0.01 |
|
|
B |
bc |
d |
bc |
c |
|
74.67±1.53 |
4.28±0.08 |
0.44±0.01 |
0.77±0.01 |
|
|
C |
ab |
c |
abc |
c |
|
78.00±1.73 |
4.94±0.01 |
0.45±0.00 |
0.78±0.01 |
|
|
D |
ab |
b |
ab |
b |
|
79.00±1.00 |
5.16b±0.08 |
0.46±0.02 |
0.82±0.01 |
|
|
E |
a |
a |
a |
a |
|
81.33±3.06 |
5.50±0.02 |
0.48±0.01 |
0.85±0.02 |
Values are means ± standard deviations of triplicate determinations. Means with different superscript in the same column differ significantly (p < 0.05).
Key
A = (Control) 100 g wheat flour
B = 100 g wheat flour + 1.5 g turmeric powder
C = 100 g wheat flour + 3.0 g turmeric powder
D = 100 g wheat flour + 4.5 g turmeric powder
E = 100 g wheat flour + 6.0 g turmeric powder
LBD = Loose Bulk Density
PBD = Packed Bulk Density
SC = Swelling Capacity
WAC = Water Absorption Capacity
Table 4: Effect of Turmeric on the Physical Properties of Wheat-Turmeric Based Bread
|
Sample |
Oven spring (cm) |
Loaf volume (cm3) |
Loaf weight (g) |
Moisture Loss |
Specific V |
|
A |
a |
a |
b |
a |
a |
|
0.50±0.01 |
621.43±0.67 |
183.3±1.05 |
12.07±0.84 |
3.39±0.02 |
|
|
B |
b |
b |
b |
a |
b |
|
-0.50b±0.01 |
549.56±0.92 |
186.5±3.48 |
10.60±3.75 |
2.95±0.06 |
|
|
C |
c |
c |
ab |
a |
bc |
|
-1.02±0.03 |
543.38±0.26 |
188.7±2.14 |
9.63±1.44 |
2.88±0.0 |
|
|
D |
d |
d |
ab |
a |
c |
|
-1.29±0.01 |
529.45±0.58 |
191.3±7.91 |
8.07±2.70 |
2.77±0.12 |
|
|
E |
e |
e |
ab |
b |
d |
|
-1.50±0.01 |
473.19±2.54 |
199.5±9.99 |
2.33±1.97 |
2.38±0.13 |
Key
A = (Control) 100 g wheat flour
B = 100 g wheat flour + 1.5 g turmeric powder
C = 100 g wheat flour + 3.0 g turmeric powder
D = 100 g wheat flour + 4.5 g turmeric powder
E = 100 g wheat flour + 6.0 g turmeric powder
The crude fibre contents of the bread samples increased significantly (p < 0.05) as the level of turmeric powder increased. The increased could be attributed to the high fibre content of turmeric roots [56]. Fibre consumption has been linked to decreased. High levels of fibre in foods help in digestion of foods and contribute to the health of the gastrointestinal tract system in humans by aiding normal bowel movement thereby reducing constipation problems which can lead to colon cancer [56]. The high fibre contents of the composite breads suggest that they would be ideal food for people suffering from obesity, diabetes, cancer and gastrointestinal disorders [50]. According to Jha et al. [57], the crude fibre contributes to the health of the gastrointestinal system and metabolic system in man. Lim et al. [45]; Ayo et al. [58]; Hussien et al. [59] reported high fibre contents of wheat-turmeric composite bread, biscuits and crackers, respectively.
Fat acts as a lubricating agent that improves the quality of bread in terms of texture and flavor. Additionally, fat provides energy and is essential as it facilitates the absorption and transport of fat-soluble vitamins A, D, E, and K [60]. Fat also plays a significant role in the shelf life of food products; however, relatively high fat content can be undesirable in baked products because it may promote rancidity. The incorporation of turmeric powder in the bread resulted in an increase in fat content, likely due to the inherent fat composition of turmeric powder.
Proteins, on the other hand, are critical macronutrients that form major components of body enzymes, antibodies, many hormones, and body fluids such as blood and milk. Proteins are essential for all forms of life and help form structural, supportive, and protective tissues, including muscles, cartilage, skin, hair, and nails [61]. The crude fat and protein contents of the breads were observed to increase significantly (p<0.05) with the addition of turmeric powder. This increase in crude fat and protein contents can be attributed to the nutritional profile of turmeric powder, which is known to contain appreciable levels of both macronutrients. Furthermore, the combination of turmeric powder and wheat flour synergistically contributed to the observed increase, as wheat flour itself contains substantial amounts of protein and some fat [62]. The progressive inclusion of turmeric powder amplified these effects, leading to the increased macronutrient levels in the composite bread samples
Carbohydrate provides heat and energy for all forms of body activities and as such its inadequacy can cause the body to divert proteins and body fat to produce needed energy and this might lead to depletion of body tissues [63]. Carbohydrate content decreased with increased substitution of wheat flour with turmeric powder. Increased and decreased carbohydrate contents of wheat, and wheat and turmeric powder composite breads could be due to the high and low carbohydrate contents of wheat and turmeric powder, respectively.
The highest value of carbohydrate obtained in bread from wheat-turmeric suggests that it will contribute more in maintenance of the plasma glucose level, sparing the body protein from being easily digested [64]. Energy is an essential property of food. The energy human body requires for every activity is supplied by food. The highest energy value obtained in bread produced from wheat could be attributed to its high carbohydrate content compared to other bread samples. This is in line with the report by Khan et al. [65], that carbohydrates are principal and indispensable sources of energy. The significant (p < 0.05) increase in the effect of turmeric powder on the moisture, ash, fibre, fat and protein contents of wheat-based bread was similar to studies by Ayo et al. [58] and Hussien et al. [59].
The proximate composition analysis of turmeric powder revealed significant (p < 0.05) values for ash, crude fibre, crude fat, and carbohydrate contents. These findings align with the results of Makanjuola and Makanjuola [62], which also reported a significant presence of essential nutrients in turmeric powder. The observed increase in ash, fat, and fibre contents in the wheat and turmeric powder composite breads with higher levels of turmeric powder substitution can be attributed to the inherently high ash, fat, and fibre contents in turmeric powder. This demonstrates that turmeric powder is a rich source of these components, which directly contributed to the elevated proximatevalues in the composite bread samples.
Effect of Turmeric Powder Addition on the Mineral Composition (mg/100g) of Wheat Based Bread
Presented in Table 6 are data on the effects of turmeric powder addition on the mineral composition of wheat-based bread. Generally, the differences in the results of the mineral parameters of all the bread samples were significant (p < 0.05). The results also showed increased values of the mineral contents with increased level of turmeric powder substitution. The magnesium (Mg), calcium (Ca), phosphorus (P), potassium (K), iron (Fe) and sodium (Na) ranged from 145.65-182.80 mg/100g, 252.39-343.68 mg/100g, 75.10-133.40 mg/100g, 26.22-36.34 mg/100g, 21.37-48.32 mg/100g, and 46.51-66.07 mg/100g, respectively.
Minerals are inorganic elements which are essential for the normal functioning of the body. They are required in smaller quantities in addition to proteins, carbohydrates, fats and vitamins, they are inorganic or “ash constituents” of foods which cannot be destroyed by heating [21]. Although they yield no energy, they have important roles to play in many activities in the body [63]. As ash content gives an insight to the mineral content of the food, hence, bread produced from wheat and turmeric composite flour can be described as a rich source of minerals as seen from the significant (p<0.05) increase in the mineral contents of breads with increased levels of turmeric powder addition. All the bread samples appeared to be good source of magnesium, calcium, phosphorus, potassium, iron and sodium.
Table 5: Effect of Turmeric Powder Addition on the Proximate Composition (%) of Wheat Based Bread
|
Sample |
Moisture |
Ash |
Fibre |
Fat |
Protein |
CHO |
|
e |
e |
e |
c |
c |
a |
|
|
A |
23.78 ±0.02 |
1.03 ±0.02 |
1.54 ±0.03 |
8.61 ±0.06 |
14.90 ±0.19 |
73.93 ±0.17 |
|
d |
d |
d |
c |
c |
b |
|
|
B |
25.16 ±0.02 |
2.40 ±0.02 |
3.04 ±0.03 |
8.64 ±0.05 |
14.96 ±0.03 |
70.97 ±0.06 |
|
c |
c |
c |
b |
bc |
c |
|
|
C |
27.40 ±0.02 |
3.44 ±0.02 |
3.19 ±0.02 |
8.81 ±0.03 |
15.18 ±0.39 |
69.38 ±0.35 |
|
b |
b |
b |
a |
ab |
d |
|
|
D |
29.20 ±0.02 |
4.20 ±0.02 |
3.40 ±0.02 |
8.91 ±0.05 |
15.55 ±0.18 |
67.93 ±0.21 |
|
a |
a |
a |
a |
a |
e |
|
|
E |
30.83 ±0.02 |
4.41 ±0.08 |
3.59 ±0.03 |
8.98 ±0.04 |
15.74 ±0.38 |
67.28 ±0.31 |
Values are means ± standard deviations of triplicate determinations. Means with different superscript in the same column differ significantly (p<0.05).
Key
A = (Control) 100 g wheat flour,
B = 100 g wheat flour + 1.5 g turmeric powder
C = 100 g wheat flour + 3.0 g turmeric powder
D = 100 g wheat flour + 4.5 g turmeric powder
E = 100 g wheat flour + 6.0 g turmeric powder
The increase in magnesium content of composite bread may largely be a pointer to the fact that turmeric is a rich source of magnesium. Magnesium in the diet and cell catalyzes hundreds of metabolic reactions resulting in changes in energy status, catalyzes the oxidative phosphorylation on adenosine diphosphate (ADP), and adenosine triphosphate (ATP). Also, the release of energy that results when ATP is converted to ADP requires magnesium [21]. Calcium is a mineral required by the body for a variety of physiological functions and the maintenance of bone tissues throughout life [64]. Calcium is necessary for supporting bone formation and growth; it also helps in the maintenance of healthy teeth, skeletal and soft tissue, mucous membranes and skin.
Phosphorus works closely with calcium to build strong bones and teeth [21]. As an essential nutrient for human health, Iron also plays an important role in normal growth and development [65]. Potassium activates several enzyme reactions and helps in the release of energy from carbohydrates, fats and proteins. It also functions with sodium and calcium to regulate neuromuscular excitability . Though the results showed relatively low contents of sodium which makes the wheat and turmeric powder bread good products for people with high blood pressure and heart disease problems.
Hussien et al. (59) revealed significant presence of mineral elements such as calcium, potassium, sodium and phosphorus in turmeric powder. The result of the effect of turmeric powder on the mineral composition of wheat-based bread is similar to the result reported by Hussien et al. [59], where significant (p<0.05) increases were also observed in mineral compositions of gluten free crackers produced with sesame and turmeric powder.
Effect of Turmeric Powder Addition on the Anti-nutrients Contents of Wheat Based Bread
Presented in Table 7 is the result of the effects of turmeric powder addition on the anti-nutrients contents of wheat-based breads. Generally, the differences in the anti-nutrient contents of the breads were significant (P < 0.05). The result showed increased anti-nutritional contents of the bread samples with increased level of turmeric powder substitution. Tannins, oxalate, Phytate, cyanide and saponin increasingly ranged from 1.67-2.68 mg/100g, 2.81-3.49 mg/100g, 4.01-5.50 mg/100g, 0.83-2.19 mg/100g and 0.90-1.67 mg/100g in 100 % wheat bread (control) and 100:6.0 g wheat and turmeric powder breads respectively.
The anti-nutritional contents of the bread samples showed low levels of tannins, oxalate, Phytate, cyanide and saponin. Similarly, low levels of tannins, oxalate, phytate, cyanide and saponin had been reported by Ayo et al. [58] for acha-turmeric.
Tannins are known for their ability to precipitate with iron and other metals, thereby reducing their absorption [67]. Tannin is an anti-nutrient that inhibits activity of digestive enzymes [68]. The lower values obtained for tannin is very important because tannic acid above 10 % of total dry weight affects overall nutritional potential of food material. Importantly, tannin can be used in treatment of skin eruption due to their astringent properties [68].
Tannins are present in virtually all parts of plants and they have molecular weight ranging from 500- 3000. When they coagulate digestive enzymes, these enzymes will not be available for their catalytic hydrolysis and this will affect the digestion of foods in the digestive tract. The result of tannin obtained in this study is lower than that reported by Edet et al. [69] with tannin content values of bread in the range 111.91 to 129.82 mg/100 g. Research has also shown that tannin could exert antimicrobial activities by iron deprivation, hydrogen bonding or specific interactions with vital proteins such as enzymes in microbial cells [58].
Oxalates affect the metabolism of magnesium and calcium. It also reacts with proteins to form complexes which have an inhibitory effect in the digestion of peptic. High oxalate diet can increase the risk of renal calcium absorption and has been implicated as a source of kidney stone. Oxalate content of the bread samples showed increased value with increased level of turmeric powder addition. Generally, small amounts of oxalate may occur in many vegetables and fruits but do not pose nutritional problems [68]. Consumption of large doses of oxalic acid causes corrosive gastroenteritis, shock, convulsive symptoms, low plasma calcium, high plasma oxalates and renal damage [70]. The toxic range or lethal dose of oxalates has been reported to be between 3-5 g for man [71]. This study therefore reveals a safe margin for the bread samples.
Phytate has strong binding capacity and forms insoluble complexes with multivalent cations, including Ca, Mg, Fe and Zn, and render them biologically unavailable [68].
There was a significant (p<0.05) difference in the phytate of the bread samples. Phytic acid has complicated effect in the human system including indigestion of food and flatulence. Phytic acid inhibits the absorption and utilization of some mineral elements. Warnick [72] observed that foods with greater than 19 mg /100 g phytic acid composition showed low iron diffusibility.
The result showed a low hydrocyanic acid content. Chakraborty and Eka [73] reported the hydrocyanic acid content of wheat (Triticum spp) to be 81.36 mg. There was a significant difference (p < 0.05) in the level of hydrocyanic acid content in bread samples. This was expected because the release of HCN from the precursor glycosides is enzymatic. Heat treatment thus affected the activity of this enzyme [58]. On the other hand, Burns et al. [74] reported that the body has a way of detoxifying small doses of cyanide in food by converting it to thiocyanide, which is excreted in the urine. However, traces of cyanide in food are of immense importance since it helps to convert inactive form (hydroxycobalamine) to the active form (cyanocobalamine). This research showed that the cyanide contents obtained in the five samples were well below the lethal dose (35 mg/kg) reported by Ekop et al. [70].
The relative increase in the saponin content with increased levels of turmeric powder could be an advantage as it has been proven to aid curing headache associated with hypertension, management of cold, chronic catarrh and migraine [58]. The levels of these anti-nutrients in all the samples were relatively low, below toxic levels and may not hinder the bioavailability of essential nutrients in the composite breads. The results are similar to the findings of Samia et al. (2012). Similar increase in antinutrients contents were also reported by Ayo et al. [58] where turmeric powder was substituted with acha flour in biscuits production.
Table 6: Effect of Turmeric Powder Addition on the Mineral Composition (mg/100g) of Wheat Based Bread
|
Sample |
Magnesium |
Calcium |
Phosphorus |
Potassium |
Iron |
Sodium |
|
A |
d |
e |
d |
e |
d |
d |
|
145.65 ±4.65 |
252.39 ±0.54 |
75.1 ±2.57 |
26.22 ±0.49 |
21.37 ±0.41 |
46.51 ±0.45 |
|
|
B |
c |
d |
c |
d |
c |
c |
|
160.27 ±2.40 |
273.94 ±0.47 |
104.6 ±0.51 |
28.36 ±0.41 |
35.17 ±0.83 |
50.73 ±0.32 |
|
|
C |
b |
c |
c |
c |
c |
c |
|
172.16 ±1.96 |
277.50 ±2.30 |
109.5 ±0.13 |
29.12 ±0.38 |
37.40 ±3.90 |
52.41 ±0.84 |
|
|
D |
a |
b |
b |
b |
b |
b |
|
178.78 ±0.11 |
289.97 ±1.12 |
121.8 ±0.60 |
30.89 ±0.44 |
41.79 ±0.60 |
62.50 ±1.74 |
|
|
E |
a |
a |
a |
a |
a |
a |
|
182.80 ±0.36 |
343.68 ±1.86 |
133.4 ±10.46 |
36.34 ±0.14 |
48.32 ±0.10 |
66.07 ±0.80 |
|
|
|
|
|
|
|
|
|
Values are means ± standard deviations of triplicate determinations. Means with different superscript in the same column differ significantly (p<0.05).
Key
A = (Control) 100 g wheat flour
B = 100 g wheat flour + 1.5 g turmeric powder
C = 100 g wheat flour + 3.0 g turmeric powder
D = 100 g wheat flour + 4.5 g turmeric powder
E = 100 g wheat flour + 6.0 g turmeric powder
Table 7: Effect of Turmeric Powder on the Anti-nutrients Contents (mg/100 g) of Wheat Based Bread
|
Sample |
Tannin |
Oxalate |
Phytate |
Cyanide |
Saponin |
|
A |
e |
e |
e |
e |
e |
|
1.67±0.15 |
2.81 ±0.02 |
4.01 ±0.02 |
0.80 ±0.02 |
0.90 ±0.04 |
|
|
B |
d |
d |
d |
d |
d |
|
1.86 ±0.03 |
2.94 ±0.08 |
4.28 ±0.03 |
0.98 ±0.02 |
1.06 ±0.05 |
|
|
C |
c |
c |
c |
c |
c |
|
2.20 ±0.04 |
3.06 ±0.08 |
4.94 ±0.12 |
1.86 ±0.01 |
1.21 ±0.03 |
|
|
D |
b |
b |
b |
b |
b |
|
2.39 ±0.05 |
3.21 ±0.03 |
5.16 ±0.04 |
1.97 ±0.02 |
1.42 ±0.03 |
|
|
E |
a |
a |
a |
a |
a |
|
2.68 ±0.02 |
3.49 ±0.03 |
5.50 ±0.01 |
2.19 ±0.01 |
1.67 ±0.03 |
Key
A = (Control) 100 g wheat flour
B = 100 g wheat flour + 1.5 g turmeric powder
C = 100 g wheat flour + 3.0 g turmeric powder
D = 100 g wheat flour + 4.5 g turmeric powder
E = 100 g wheat flour + 6.0 g turmeric powder
Effect of turmeric powder addition on the crumb colour parameters of wheat-based bread
The result of the effect of turmeric powder addition on the crumb colour parameters of wheat-based bread is presented in Table 8. The chromatic parameters exhibited significant differences (p < 0.05).
The L*, a, b, BI, WI, YI and %∆E values of the bread samples ranged from 25.49-51.72, 5.87-7.75, 6.70-17.97, 45.86-58.33, 24.96-47.94, 37.56-52.26 and 9.36-34.75, respectively.
The result of the effect of turmeric powder on the crumb colour parameters of wheat as presented in Table 8 showed increase in redness (a*), yellowness (b*) and YI with the addition of turmeric powder, indicating redder and yellower crumb was obtained as a result a turmeric powder addition. The colour change of breads might be related to the fact that turmeric pigments, curcumoids and phenolic compounds underwent oxidation reaction and sugars participated in caramelization during baking.
Although colour could be affected by that of the raw materials, colour formation during the baking stage is mainly attributed to reducing sugars that react with the amino acids present in the flour via Maillard reaction or caramelisation. The results presented here are in agreement with that of Lim et al. [45] who also found that addition of turmeric powder increased product crumb redness and yellowness and a significant (p < 0.05) reduction in lightness.
Table 8: Effect of Turmeric Powder on the Crumb Colour Parameters of Wheat Based Bread
|
Sample |
L |
A |
B |
BI |
WI |
YI |
(∆E) % |
|
A |
d |
d |
e |
c |
d |
c |
e |
|
51.72±0.01 |
5.87±0.03 |
6.70±0.02 |
45.86±0.12 |
24.96±0.01 |
37.56±0.08 |
9.36±0.00 |
|
|
b |
c |
b |
ab |
b |
a |
b |
|
|
B |
41.27±0.15 |
6.94±0.05 |
15.10±0.07 |
56.02±0.10 |
38.96±0.12 |
52.26±0.07 |
28.60±2.71 |
|
c |
a |
c |
a |
e |
ab |
c |
|
|
C |
33.05±0.10 |
7.75±0.02 |
11.55±0.05 |
58.33±0.05 |
31.62±0.08 |
49.91±0.05 |
18.53±0.11 |
|
d |
c |
d |
ab |
d |
b |
d |
|
|
D |
28.35±0.14 |
7.03±0.05 |
9.29±0.05 |
56.10±0.09 |
27.41±0.13 |
46.81±0.04 |
13.36±0.15 |
|
E |
a |
b |
a |
b |
a |
ab |
a |
|
25.49±5.29 |
7.37±0.26 |
17.97±0.58 |
51.94±6.70 |
47.94±4.97 |
49.99±5.45 |
34.75±1.43 |
Values are means ± standard deviations of triplicate determinations. Means with different superscript in the same column differ significantly (p<0.05).
Key
A = (Control) 100 g wheat flour
B = 100 g wheat flour + 1.5 g turmeric powder
C = 100 g wheat flour + 3.0 g turmeric powder
D = 100 g wheat flour + 4.5 g turmeric powder
E = 100 g wheat flour + 6.0 g turmeric powder
L = Lightness
a = Redness to Greenness
b = Yellowness to Blueness
BI = Browning Index
WI = Whiteness Index
YI = Yellow Index
∆E = Energy Change
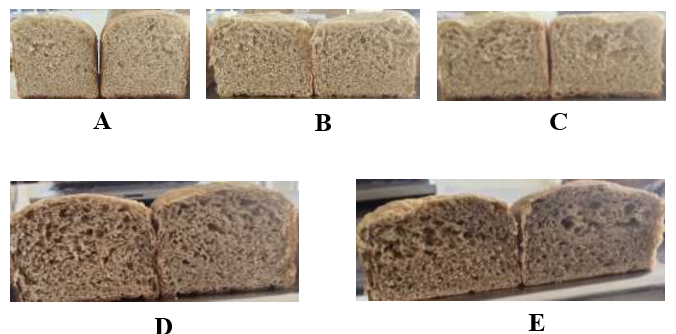
Figure 3: Effect of Turmeric Powder on the Crumb Colour of Wheat Based Bread
Key
A = (Control) 100 g wheat flour
B = 100 g wheat flour + 1.5 g turmeric powder
C = 100 g wheat flour + 3.0 g turmeric powder
D = 100 g wheat flour + 4.5 g turmeric powder
E = 100 g wheat flour + 6.0 g turmeric powder
Effect of Turmeric Powder on the Sensory Attributes of Wheat Based Bread
Results on the sensory attributes of breads formulated from wheat and turmeric powder bread are presented in Table 9. The bread samples showed decreased values in all the sensory parameters with increased level of turmeric powder addition. The crust appearance, crumb appearance, taste, aroma, texture and overall acceptability ranged from 7.87-4.67, 8.47-4.87, 8.47-4.33, 7.93-4.33 and 8.73-4.87 in the 100 % wheat bread which is the control and 100:6.0 g wheat and turmeric powder bread, respectively.
Sensory evaluation is usually carried out towards the end of product development or formulation cycle and this is done to assess the reactions of consumers/judges about the product to determine the acceptability of such product. It is an important criterion for assessing quality in the development of new products and for meeting consumer requirements [75].
Appearance is an important sensory attribute of any food because of its influence on acceptability. The brown colour resulting from maillard reaction is always associated with baked goods. The study showed significant decrease in the crust and crumb appearances of the bread samples with increased turmeric powder substitution. This is due to the light yellow to darkish nature of turmeric rhizome.
According to Sudha et al. [76], progressive increase in supplementation with non-wheat flour, appearance turns towards darker leading to lower acceptability. Appearance change also, might be due to caramelization, dextrinization of starch or Maillard reaction involving the interaction of reducing sugar or proteins. Sengev et al. [51] reported similar darkish nature of bread on supplementation of wheat flour with watermelon seed-cassava composite flour and Moringa oleifera leaf powder, respectively. Taste is also a sensory parameter that affects the quality and acceptability of food products. No matter how rich or nutritious a food is, if it tastes bad, such food would not be accepted by the people. Taste is one of the primary factors determining the acceptability of any product and has the highest impact in determining the market success of product. The taste scores showed decreased values with increased turmeric powder. This might be due to the choking nature of turmeric rhizome. Substitution of wheat flour with turmeric powder at 100:1.5 g and 100:3.0 g blends did not significantly (p ≥ 0.05) affect the taste of the breads with the control sample.
Aroma is another attribute that influences the acceptability of baked good products even before they are tasted. From the result of the sensory attributes of breads, there is decreasing trend in the mean score of aroma as the level of supplementation increased downwards. The results are in consistent with those observed in earlier studies by Adegoke et al. [56] in which wheat flour was supplemented with turmeric powder in biscuits production and Ayo et al. [58] in which acha flour was supplemented with turmeric powder in biscuit production. Overall acceptability was determined on the basis of quality scores obtained from evaluation of crust and crumb appearance, taste and aroma. Mohamed et al. [77] and reported similar decreased values of overall acceptability of wheat- based crackers and breads supplemented with turmeric powders.
Table 9: Effect of Turmeric Powder Addition on the Sensory Attributes of Wheat Based Bread
|
Sample |
Appearance |
|
Taste |
Aroma |
Overall acceptability |
|
Crust |
Crumb |
||||
|
A |
a |
a |
a |
a |
a |
|
7.87±0.92 |
8.47±0.74 |
8.47±0.92 |
7.93±0.96 |
8.73±0.59 |
|
|
B |
a |
b |
ab |
ab |
a |
|
7.53±0.83 |
7.47±1.06 |
7.53±2.03 |
7.00±1.60 |
8.13±1.13 |
|
|
C |
b |
b |
bc |
bc |
b |
|
6.47±0.64 |
6.73±1.16 |
6.73±1.49 |
6.40±1.40 |
7.13±1.36 |
|
|
D |
c |
c |
c |
c |
c |
|
5.67±1.11 |
5.80±1.21 |
5.67±1.76 |
5.80±1.57 |
6.13±1.51 |
|
|
d |
d |
d |
d |
d |
|
|
E |
4.67±1.40 |
4.87±1.51 |
4.33±1.80 |
4.33±1.63 |
4.87±1.69 |
|
|
|
|
|
|
|
Values are means ± standard deviations of 20 panellist. Means with different superscript in the same column differ significantly (p<0.05).
Key
A = (Control) 100 g wheat flour
B = 100 g wheat flour + 1.5 g turmeric powder
C = 100 g wheat flour + 3.0 g turmeric powder
D = 100 g wheat flour + 4.5 g turmeric powder
E = 100 g wheat flour + 6.0 g turmeric powder
CONCLUSION
This study investigated the effect of turmeric powder on the quality and color properties of wheat bread. The findings revealed the following:
The results of the functional properties showed, the addition of turmeric powder to wheat flour increased water absorption capacity, swelling index, and both loose and packed bulk densities.
The results of the functional properties showed, the addition of turmeric powder to wheat flour increased water absorption capacity, swelling index, and both loose and packed bulk densities.
The results of the physical properties of the bread revealed, bread samples with higher turmeric powder levels showed decreased oven spring, loaf volume, and specific volume, but increased loaf weight.
The result of the proximate composition of bread samples showed significant increases (p < 0.05) in moisture, ash, crude fibre, crude fat, and protein contents, with a corresponding decrease in carbohydrate content as turmeric powder levels increased.
The results of the mineral contents of bread samples revealed, magnesium, calcium, phosphorus, potassium, iron, and sodium increased with higher turmeric powder levels. However, anti-nutritional factors in the bread samples showed a similar increasing trend.
The colour results of the bread samples revealed significant increases in redness, yellowness, and yellow index, with a reduction in lightness in the crust, crumb, and base of bread samples.
The results of the sensory scores of bread samples supplemented with up to 3.0g of turmeric powder was acceptable to panelists, while higher levels (4.0g and 6.0g) were less liked. Bread made from 100% wheat flour was the most preferred among other samples.
REFERENCES
- Satter MA, Abedin N, Jabin SA, Islam MF, Hossain N, Ahsan A, et al. (2021). Comparative assessment of nutritive values and safety characteristics of bread sold in Bangladesh. Food Research. 5(1):417-425.
- Islam MZ, Shams Ud-Din M, Haque MA. (2011). Studies on the effect of brown rice and maize flour on the quality of bread. Journal of Bangladesh Agricultural University. 9:297–304.
- Ijah UJJ, Auta HS, Aduloju MO, Aransiola SA. (2014). Microbiological, nutritional and sensory quality of bread produced from wheat and potato flour blends. International Journal of Food Science. 2014:671–701.
- Unachukwu M, Nwakanma C. (2018). The fungi associated with the spoilage of bread in Enugu state. International Journal of Current Microbiology and Applied Sciences. 4:989–995.
- Paswan VK, Rose H, Singh CS, Yamini S, Rathaur A. (2021). Herbs and spices fortified functional dairy products. Herbs and Spices-New Processing Technologies. 2:1–17.
- Daniel CK. (2014). The effect of garlic extracts on the control of postharvest pathogens and postharvest decay of apples (Doctoral dissertation, Stellenbosch: Stellenbosch University).
- Muhammad A, Rahman Z, Ayub M, Durrani Y, Ali SA, Tabassum A, et al. (2014). Inhibitory effect of ginger and turmeric on Rhizopus stolonifer growth on bread. Journal of Food Processing and Technology. 5(5):1–16.
- Jaggi L (2012). Turmeric, Curcumin and Our Life: A Review. Bulletin of Environment, Pharmacology and Life Sciences. 1:11–17.
- Enemor VHA, Ogbodo UC, Nworji OF, Ezeigwe OC, Okpala CO, Iheonunekwu GC. (2020). Evaluation of the nutritional status and phytomedicinal properties of dried rhizomes of Turmeric (Curcuma longa). Journal of Biosciences and Medicines. 8(8):163–179.
- Azmi NS, Bhat R, Yeoh TK. (2016). Quality evaluation of novel cookies prepared by supplementing with fresh turmeric flower (Curcuma longa L.) extracts as a value-added functional ingredient. International Food Research Journal. 23(4):1–15.
- Devassy JG, Nwachukwu ID, Jones PJ. (2015). Curcumin and cancer: barriers to obtaining a health claim. Nutrition Reviews. 73(3):155–165.
- Prathapan A, Lukhman M, Arumughan C, Sundaresan A, Raghu KG. (2009). Effect of heat treatment on curcuminoid, colour value and total polyphenols of fresh turmeric rhizome. International Journal of Food Science and Technology. 44:1438–1444.
- Amer EA, Ramadan MF, Abd-Elhamid AM. (2019). Chemical composition and nutritional evaluation of wheat and its products. International Journal of Food Sciences and Nutrition. 70(3):123–132.
- Gupta SC, Sung B, Kim JH, Prasad S, Li S, Aggarwal BB. (2020). Multi-targeting by turmeric, the golden spice: From kitchen to clinic. Molecular Nutrition and Food Research. 57(9):1510–1528.
- Park SH, Lim HS, Hwang SY. (2011). Evaluation of antioxidant, rheological, physical and sensorial properties of wheat flour dough and cake containing turmeric powder. Food Science and Technology International. 18(2):1–8.
- Joseph A, Isaac A, Vida B, Pearl BA, Josephine AB. (2016). Nutrient Composition and Sensory Evaluation of Ripe Banana Slices and Bread Prepared from Ripe Banana and Wheat Composite Flours. American Journal of Food and Nutrition. 4(4):103–111.
- Onwuka GI. (2005). Food analysis and instrumentation: theory and practice. 1st ed. Lagos: Naphthali Prints.
- Kakar A, Miano TF, Soomro AH, Yar A, Memon S, Khan B, et al. (2022). Oil and water absorption capacity of wheat, rice and gram flour powders. International Journal of Ecosystems and Ecology Science (IJEES). 12(2):585-594 .
- AOAC. (2012). Official Methods of Analysis of AOAC International. 19th edition. Gaithersburg, Maryland, USA: AOAC International.
- Ihekoronye AI, Ngoddy PO. (1985). Integrated Food Science and Technology for the Tropics. London: Macmillan Publ. Ltd. p. 265.
- Chinma CE, Igyor MA. (2007). Micronutrients and Anti-nutritional Contents of Selected Tropical Vegetables Grown in Southeast, Nigeria. Nigerian Food Journal. 25(1):111–116.
- Onwordi CT, Ogungbade AM, Wusu AD. (2009). The proximate and mineral composition of three leafy vegetables commonly consumed in Lagos, Nigeria. African Journal of Pure and Applied Chemistry. 3(6):102–107.
- Coţovanu I, Mironeasa S. (2022). Influence of buckwheat seed fractions on dough and baking performance of wheat bread. Agronomy. 12(1):137–150.
- Araki E, Ikeda MT, Ashida K, Tanaka K, Yanaka M, Iida S. (2009). Effects of Rice Flour Properties on Specific Loaf Volume of one-loaf Bread made from Rice Flour with Wheat Vital Gluten. Journal of Food Science and Technology Research. 15(4):439-448.
- De Vitte K, Kerziene S, Klementavičiūtė J, De Vitte M, Mišeikienė R, Kudlinskienė I, et al. (2022). Relationship of β-casein genotypes (A1A1, A1A2 and A2A2) to the physicochemical composition and sensory characteristics of cows’ milk. Journal of Applied Animal Research. 50(1):161–166.
- Ochelle PO, Kazeem AS, Onyenwe IC. (2025). Functional Properties, Proximate Composition, and Sensory Evaluation of Maize Ogi Enriched With African yam bean (Styhenostylis Stenocarpa), Soy Flours (Glycine max), and Their Protein Isolates. Neutraceutical Research. 4(2):15.
- Adeleke RO, Odedeji JO. (2010). Functional properties of wheat and sweet potato flour blends. Pakistan Journal of Nutrition. 9(6):535–538.
- Ohizua ER, Abiodun AA, Micheal AI, Olajide PS, Adeniyi TA, Raphael OI, et al. (2016). Nutrient Composition, Functional, and Pasting Properties of Unripe Cooking Banana, Pigeon Pea, and Sweet Potato Flour Blends. Journal of Food Science and Nutrition. 5(3):750–762.
- Ojo MO, Ariahu CC, Chinma EC. (2017). Proximate, Functional and Pasting Properties of Cassava Starch and Mushroom (Pleurotus pulmonarius) Flour Blends. American Journal of Food Science and Technology. 5(1):11–18.
- Kolawole OF, Chidinma AO. (2015). Physical, Functional, and Pasting Properties of Flours from Corms of two Cocoyam (Colocasia esculenta and Xanthosoma sagittifolium) cultivars. Journal of Food Science and Technology. 52(6):3440–3448.
- Anthony NM, Sawi MK, Aiyelaagbe OO, Taiwo A, Winnebah T, Fomba SN. (2014). Proximate Characteristics and Complementary Assessment of Five Organic Sweet Potatoes Cultivars and Cowpea Varieties. International Journal of Engineering Science. 3(9):38–42.
- Yusufu MI, Akhigbe AO. (2014). The Production of Pawpaw Enriched Cookies: Functional, Physico-Chemical and Sensory characteristics. Asian Journal of Agriculture and Food Science. 2(2):100–106.
- Gordon MS. (2013). Simulation Tools for the Thermal Processing of Foods. Food Technology Information. 8:100–103..
- Okpala L, Okoli E, Udensi E. (2012). Physico-chemical and Sensory Properties of Cookies made from Blends of Germinated Pigeon Pea, Fermented Sorghum, and Cocoyam Flours. Journal of Food Science and Nutrition. 1(1):8–14.
- Akinwale TE, Shittu TA, Adebowale ARA, Adewuyi S, Abass AB. (2017). Effect of soy protein isolate on the functional, pasting, and sensory acceptability of cassava starch‐based custard. Food Science and Nutrition. 5(6):1163–1169.
- Oppong D, Arthur E, Kwadwo SO, Badu E, Sakyi P. (2015). Proximate Composition and some Functional Properties of Soft Wheat Flour. International Journal of Innovative Research in Science, Engineering and Technology. 4(2):753–758
- Onabanjo OO, Ighere DA. (2014). Nutritional, Functional and Sensory Properties of Biscuit Produced from Wheat-Sweet Potato Composite. Journal of Food Technology. 1(2):111–121.
- Akinwale TO, Adeyemi OJ, Olatunji KL. (2019). Effect of natural additives on the physicochemical properties of composite flours. Journal of Food Science and Nutrition Research. 8(4):234–242.
- Menon S, Lea RA, Ingle S, Sutherland M, Wee S, Haupt LM, et al. (2015). Effects of dietary folate intake on migraine disability and frequency. Headache: Headache. 55(2):301–309.
- Malomo O, Ogunmoyela OAB, Adekoyeni OO, Jimoh O, Oluwajoba SO, Sobanwa MO. (2012). Rheological and Functional Properties of Soy-poundo Yam Flour. International Journal of Food Science and Nutrition Engineering. 2(6):101–107.
- Amandikwa C. (2012). Proximate and Functional Properties of Open Air, Solar and Oven Dried Cocoyam Flour. International Journal of Agriculture and Rural Development. 15(2):988–994.
- Ubbor SC, Ekeh JI, Agwo OE, Iguh BN. (2022). Physicochemical and Sensory Properties of Cookies produced from Composite Flour of Wheat, Acha and Whole Orange Fleshed Sweet Potato. Nigeria Agricultural Journal. 53(1):248–259.
- Arukwe DC. (2021). Proximate composition, functional and pasting properties of wheat flour supplemented with combined processed pigeon pea flour. International Journal of Food Science and Nutrition. 6:59–64.
- Kusumayanti H, Handayani NA, Santosa H. (2015). Swelling power and water solubility of cassava and sweet potatoes flour. Procedia Environmental Sciences. 23:164–167.
- Lim HS, Park SH, Ghafoor K, Hwang SY, Park J. (2011). Quality and antioxidant properties of bread containing turmeric (Curcuma longa L.) cultivated in South Korea. Food Chemistry. 124(4):1577–1582.
- Abdelghafor RF, Mustafa AI, Ibrahim AMH, Krishnan PG. (2011). Quality of bread from composite flour of sorghum and hard white winter wheat. Advance Journal of Food Science and Technology. 3(1):9–15.
- Makinde FM, Akinoso R. (2014). Physical, Nutritional and Sensory Qualities of Bread Samples made with Wheat and Black Sesame (Sesamum indicum Linn) Flours. International Food Research Journal. 21(4):1635–1640.
- Yusnita H, Wong FL. (2011). Physicochemical Properties and Acceptance of High FiberFibre Bread Incorporated with Corn Cob Flour. In: The 12th ASEAN Food Conference, BITEC Bangna, Bangkok, Thailand.16–18:647–651.
- Iftikhar AS, Nida S, Asadullah M, Aijaz HS, Shahzor GK. (2017). Loaf Characteristics and Sensory Properties of whole Wheat Bread Fortified with Sorghum and Rice Flour. Journal of Basic and Applied Sciences. 13:606–610.
- Ufot EI, Inemesit EA. (2016). Physico-chemical and Sensory Qualities of Functional Bread produced from wholemeal wheat and unripe plantain composite flours. MOJ Food Process Technol. 2(2):48-53.
- Sengev AI, Joseph OA, Gernah DI. (2013). Effect of Moringa oleifera Leaf Powder Supplementation on Some Quality Characteristics of Wheat Bread. Food and Nutrition Sciences. 4:270–275.
- Igbabul B, Num G, Amove J. (2014). Quality Evaluation of Composite Bread Produced from Wheat, Maize and Orange Fleshed Sweet Potato Flours. American Journal of Food Science and Technology. 2(4):109–115.
- Amandikwa C, Iwe MO, Uzomah A. (2015). Physic-chemical Properties of Wheat-yam Flour Composite Bread. Nigerian Food Journal. 33(1):12–17.
- Ochelle PO, Ikya JK, Ameh CO, Gbaa ST (2019). Quality Assessment of Bread from Wheat, Water Yam, and Soybean Flours. Asian Food Science Journal. 10(3):1–8.
- Abdellatif AM, Ziena HM, Rozan MA. (2023). Turmeric powder enhances the chemical, microbiological, sensorial, and shelf-life quality of bun-bread. Food Research. 7(1):271–279.
- Adegoke GO, Oyekunle AO, Afolabi MO. (2017). Functional biscuits from wheat, soya bean and turmeric (Curcuma longa): optimization of ingredients levels using response surface methodology. Research Journal of Food and Nutrition. 1:13–22.
- Jha SK, Singh HR, Prakash P. (2017). Dietary fiberfibre and human health: an introduction. In: Dietary fiberfibre for the prevention of cardiovascular disease. Academic Press; pp. 1–22.
- Ayo JA, Ojo MO, Omelagu CA, Najime MK. (2018). Proximate, Phytochemical composition and sensory qualities of acha-tumeric flour and biscuits. Asian Food Science Journal. 5(2):1-6.
- Hussien H, El-Adly NA, Shams OS, Mohamed E. (2020). Production of High Nutritional Value Gluten Free Crackers with Sesame and Turmeric Powder. Egyptian Journal of Food. 48(2):291-302.
- Olapade AA, Oluwole OB. (2013). Bread making Potential of Composite Flour of Wheat-Acha (Digitariaexilis staph) Enriched with Cowpea (Vigna unguiculata L. walp) Flour. Nigeria Food Journal. 31(1):6–12.
- Chidinma WA, Jiddari WU, Hassan SC. (2010). A Student Handbook on Food and Nutrition. 1st edition. Kaduna: De-New Creation Prints Ltd Publishers; p. 222.
- Makanjuola OM, Makanjuola JO. (2018). Proximate and Selected Mineral Composition of Ripe Pawpaw (Carica papaya) Seeds and Skin. Journal of Scientific and Innovative Research. 7(3):75–77.
- Keesey RE, Powley TL. (2008). Body energy homeostasis. Appetite. 51(3):442–445.
- Grosvernor MB, Smolin LA. (2012). Nutrition: From Science to Life. Harcourt College Publishers, New York, USA. pp. 288–371.
- Inyang UE, Ekop VO. (2015). Physico-Chemical Properties and Anti-nutrient Contents of Unripe Banana and African Yam Bean Flour Blends. International Journal of Nutrition and Food Sciences. 4(5):549–554.
- Ramulu P, Udayaekhara RP. (1997). Effect of Processing on Dietary Fibre Content of Cereals and Pulses. Plant Foods for Human Nutrition Journal. 50:249–257.
- Adesuyi AO, Ipinmoroti KO. (2011). The Nutritional and Functional Properties of the Seed Flours of three Varieties of Carica Papayapapaya. Current Research in Chemistry. 3(1):70–75.
- Oyeleke GO, Isola AD, Salam MA, Ajao FD. (2013). Evaluation of Some Chemical Composition of Pawpaw (Carica papaya) Seeds under Normal Storage Ripening. IOSR Journal of Environmental Science, Toxicology and Food Technology. 4(6):18–21.
- Edet A, Eseyin O, Aniebiet E. (2015). Anti-nutrients composition and mineral analysis of allium cepa (onion) bulbs. African Journal of Pharmacy and Pharmacology. 9(13):456–459.
- Ekop AS, Obot IB, Ikpatt EN. (2007). Anti-nutritional factors and potassium bromate content in bread and flour samples in Uyo Metropolis, Nigeria. Journal of Chemistry. 5:736–741.
- Zula AT, Ayele DA, Egigayhu WA. (2020). Proximate, antinutritional, microbial, and sensory acceptability of bread formulated from wheat (Triticum aestivum) and amaranth (Amaranthus caudatus). International Journal of Food Science. 2020: 9429584.
- Warnick B. (2015). The sixth canon: Belletristic rhetorical theory and its French antecedents. Univ of South Carolina Press.
- Chakraborty R, Eka OU. (2018). Studies on hydrocyanic, oxalic and phytic acid content of foodstuffs. West African Journal of Biological and Applied Chemistry. 21(1–4):50–55.
- Burns AE, Bradbury JH, Cavagnaro TR, Gleadow RM. (2012). Total cyanide content of cassava food products in Australia. Journal of Food Composition and Analysis. 25(1):79–82.
- Dogo SB, Doudjo S, Mohamed AY, Ernest KK. (2018). Physico-Chemical, Functional and Sensory Properties of Composite Bread prepared from Wheat and defatted Cashew (Anacardium occidentale L.) Kernel Flour. International Journal of Environmental and Agriculture Research. 4(4):88–98.
- Sudha ML, Vetrimani R, Leelavathi K (2017). Influence of Fibre from Different Cereals on the Rheological Characteristics of Wheat Flour Dough and on Biscuit Quality. Journal of of Food Chemistry. 100:1365–1373.