2023: Volume 2, Issue 1
Article In Press
 Abstract
  PDF
PDFAn Investigation into the Adsorption Efficiency of Food Waste for Diverse Heavy Metal Removal
Manbir Singh1,*, Mini Sharma2, Rajan Sharma3
1Head of Department, Associate Professor, Food Science and Technology, Khalsa College, Amritsar, India
2Assistant Professor, Dietetics and Nutrition, Khalsa College for Women, Amritsar, India
3Assistant Professor, Food Science and Technology, Khalsa College, Amritsar, India
Corresponding author: Manbir Singh, Head of Department, Associate Professor, Food Science and Technology, Khalsa College, Amritsar, India; Email: [email protected]
Received Date: October 17, 2023
Publication Date: December 11, 2023
Citation: Singh M, et al. (2023). An Investigation into the Adsorption Efficiency of Food Waste for Diverse Heavy Metal Removal. Nutraceutical Res. 2(1):02.
Copyright: Singh M, et al. © (2023).
ABSTRACT
Food waste residue poses a persistent global challenge. This research delves into the potential of utilizing adsorbents derived from food waste residue, referred to as AFWR, to extract heavy metals from food waste. The study successfully crafted low-cost adsorbents from tea waste and explored their capacity to remove stubborn compounds from synthetic wastewater. Moreover, the study applied response surface methodology to examine the interactive influence of key parameters: adsorbent dosage, initial concentration, solution pH, and adsorbent quantity.
Tea waste emerges as a cost-effective and efficient adsorbent for eliminating copper ions from wastewater. Experimental findings revealed that under optimal conditions (pH 5, 120 minutes of contact time, 1g of adsorbent per 200ml, and a 10ppm concentration), tea waste achieved an impressive 95.98% removal of copper ions. These experiments on adsorbents hold significant promise for the development of suitable technologies aimed at purging heavy metal ions from polluted industrial effluents.
Keywords: Absorbents, Atomic absorption, FTIR, Heavy metals, Tea waste, Industrialization
INTRODUCTION
Human activities, driven by industrialization, urbanization, and agricultural practices, are causing significant harm to the environment, water bodies, and land. Industrial discharges are particularly problematic, as they introduce a variety of pollutants, including heavy metals, greases, and pesticides, into rivers, ponds, and groundwater (Ideriah et al., 2012) [1]. It is crucial to note that wastewater from industries, municipalities, and a community ultimately finds its way back into the environment.
When untreated wastewater is released onto land without proper treatment, it undergoes various processes such as diffusion, mechanical dispersion, chemical reactions, and adsorption. The end result of this contamination is the accumulation of heavy metals in the soil, where they can persist for years (Akhtar et al., 2021) [2]. Moreover, when untreated wastewater contaminated with heavy metals enters aquatic systems, certain microorganisms and plants in those systems have the ability to bioaccumulate and biomagnify these toxic elements in the environment (Ali et al., 2019) [3].
The consumption of organisms and plants that have bioaccumulated heavy metals can have detrimental effects not only on the health and reproductive capacity of these species but also on human health (Benhima et al., 2008) [4]. These organisms and plants often serve as major sources of protein for humans (Davies et al., 2006) [5].
Contamination of water with toxic pollutants, especially heavy metals like lead, arsenic, mercury, chromium, nickel, and others, is a major contributor to the increase in deadly diseases (Balali-Mood et al., 2021) [6]. These metals are non-biodegradable and carcinogenic in nature, and even trace amounts can lead to chronic health problems for both humans and other living creatures. Heavy metals disrupt the normal functioning of enzymes and result in metabolic alterations that pose severe health risks (Rau and Amit, 2002) [7].
Diseases associated with exposure to heavy metals include gastrointestinal disorders, kidney and liver damage (Reena et al., 2011) [8], diarrhea, stomatitis, tumours, discoloration of stool, ataxia, paralysis, vomiting, convulsions, depression, and pneumonia when volatile vapors and fumes are inhaled (Ogwuebgu and Muhanga, 2005) [9].
To mitigate the impact of metal-containing wastewater, various treatment methods are employed, including reverse osmosis, solvent extraction, membrane filtration, reduction and precipitation, ion exchange, and other processes (Salman and Mohamed, 2013) [10]. However, low-cost adsorbents can offer a more economical alternative to these expensive techniques. These adsorbents include microbial biomass, peat, compost, leaf-mold, palm press fibres, coal, sugarcane bagasse, straw, wool fibers, and by-products of rice mills, soybeans, cottonseed hulls, tea waste, Azadirachta indica (Neem) leaf powder, pomegranate peel, olive bagasse, and hazelnut ( Hadmohammadi, 2011) [11].
India, in particular, generates an enormous amount of waste daily, much of which ends up in landfills on the outskirts of cities, leading to environmental pollution and disease spread (Wasewar et al., 2008) [12]. The tea industry in India produces a significant amount of waste (FAO, 2009) [13], with a substantial portion going unused (Wasewar, 2010) [14]. Given that tea is one of the most widely consumed beverages globally, there is an opportunity to explore the potential use of tea waste for various purposes (Arvanitoyannis and Varzakas, 2008) [15].
Tea waste, like other biomass residues, contains cellulose, lignin, and carbohydrates with hydroxyl groups in their structures (Aikpokpodian et al., 2010) [16]. Approximately one-third of the dry matter in tea leaves has the potential to serve as a metal scavenger in solution and wastewater due to these functional groups. However, during the degradation process, tea waste can pose environmental hygiene problems by releasing organic matter into water environments (Habib et al., 2007) [17].
In addition to tea waste, other agricultural residues like sugarcane bagasse, coconut jute, nut shells, rice straw, rice husk, and crop waste can be utilized effectively in wastewater treatment due to their high adsorption capacity and cost-effectiveness (Nandan and Ranghabhashiyam, 2023) [18]. These adsorbents are renewable, biodegradable, efficient, and require minimal processing, such as grinding, drying, and washing (Azmat and Akhter, 2010) [19].
Furthermore, agricultural residues, such as tea waste, have been employed in agricultural applications to enhance crop production under heavy metal stress conditions (Hasar and Cuci, 2000) [20]. This demonstrates the multifaceted potential of agricultural and industrial by-products with biological activities in addressing environmental and health challenges. Researchers have successfully used tea waste as an adsorbent to remove heavy metals such as cadmium, lead, and nickel from industrial wastewater, achieving substantial removal rates Mahavi et al. (2005) [21].
In summary, the indiscriminate release of pollutants, especially heavy metals, into the environment through industrial, urban, and agricultural activities poses significant risks to ecosystems and human health. The use of low-cost adsorbents derived from agricultural and industrial waste can offer an effective and sustainable solution for mitigating the impact of heavy metal contamination in wastewater. Additionally, proper waste management practices are essential to reduce the environmental and health risks associated with waste disposal.
MATERIALS AND METHODS
Materials and Reagent or Chemicals Used
Equipment used: All glass wares (Conical flasks, Pipette, Measuring cylinders, Beakers, Petri plates and Test tubes etc). The instruments and apparatus used throughout the experiment are listed in table (1).
Table 1: List of Instruments used during the whole experiment.
|
S. No. |
Instrument/Model |
Use |
|
1. |
Atomic adsorption Spectrophotometer (Perkin Elmer 3100) |
Metal detection |
|
2. |
Digital Weight Balance (Wesner) |
Weighing |
|
3. |
What man filter paper no. 1 assembly (Labline) |
To filter or separate absorbent from solution |
|
4. |
Orbital shaker (Labline) |
Used to agitate the absorbent with aqueous metal ion mixtures |
|
5. |
pH meter (Labline) |
To measure the pH of the solution |
|
6. |
Sieve analyzer (Labline) |
Particle size determination |
|
7. |
FTIR instrument (Perkin Elmer) |
To determine the various functional groups on the surface of the tea waste |
Reagent or Chemicals used
All chemical used were of analytical grade for heavy metal solution; reagent grade concentrated sulfuric acid and NaOH were used to adjusted pH values of samples, Nitric acid conc. was used. In all experimental work, distilled demineralized water is used.
Adsorbent collection and preparation
Tea waste sourced from Khalsa College; Amritsar canteens underwent a series of preparation steps. First, it was subjected to multiple washes with distilled water at a temperature of 85°C until the color was completely removed. Subsequently, the treated tea waste was dried in a hot oven at 105°C for duration of 18 hours.
To activate the material, it was immersed in phosphoric acid (H3PO4) as an activating agent for 12 hours. This process facilitated the creation of pores on the surface of the tea waste. Following activation, the material was thoroughly washed until it reached a neutral pH level. Afterward, it was once again dried, this time at 105°C for 12 hours, and stored in plastic bags at room temperature. This prepared material was now ready for use as an adsorbent.
The activation method for the adsorbent involved manually crushing 100 grams of the tea sample. Subsequently, a 70 ml dilute phosphoric acid solution was utilized to digest the tea waste, and the mixture was kept at 30°C for 12 hours. Following digestion, the sample underwent another round of washing to restore its pH to a neutral level.
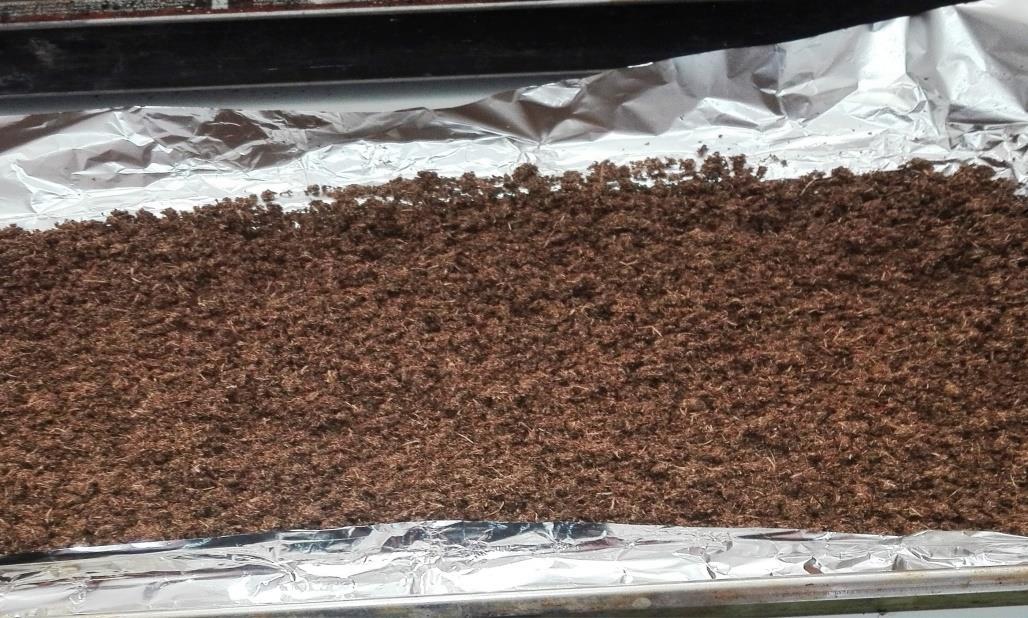
Figure 1: Tea waste (Adsorbent) collected and oven dried.
Experimental procedures
The overall experimental activities carried out in the study were illustrated in the following Figure (2).
The tea waste was meticulously rinsed with demineralized water multiple times until all traces of tea color were completely removed. Subsequently, it underwent a drying process in an oven set at 105°C for 18 hours and was then immersed in H3PO4 at a temperature of 30°C for 12 hours to eliminate impurities. Following this, the tea waste was once more subjected to a thorough washing and drying at 105°C for 12 hours to attain a neutral state, completely devoid of impurities. It was subsequently ground into a fine powder, which served as the material for the optimization and characterization of the adsorbent. This powder was carefully stored for future use in batch adsorption studies.
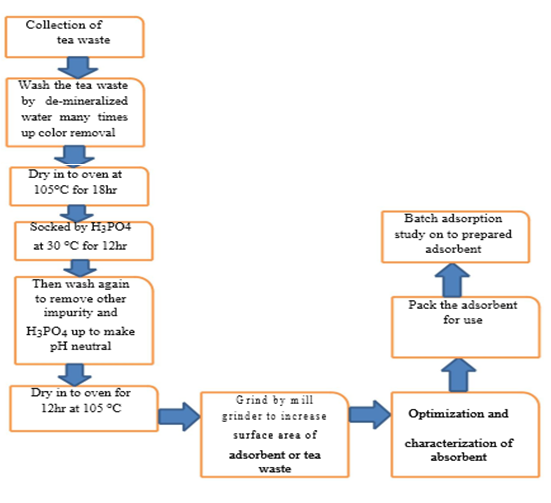
Figure 2: The overall experimental procedures.
Characterizations of Adsorbent
Tea waste underwent a physical examination in accordance with an American Standard Testing Method (ASTM). The proximate analysis of the adsorbent involved assessing its moisture content, volatile matter, fixed carbon, and ash content. Additionally, Fourier transform infrared (FTIR) spectral analysis was employed to investigate the structural and morphological attributes of the adsorbents.
Ash content determination
A crucible was thoroughly cleaned by subjecting it to 30 minutes of hot air oven drying at a temperature of 105°C. Following this heating step, the crucible was allowed to cool within a desiccator for an additional 30 minutes. The crucible was then precisely weighed using an analytical balance. To conduct the experiment, precisely 1 gram of the sample was placed into the crucible, and its weight was meticulously recorded. Subsequently, the loaded crucible was introduced into a muffle furnace, which was maintained at a constant temperature of 500°C for one hour. This extended heating period was essential to ensure the complete removal of carbonaceous materials, resulting in the formation of white ash. After the crucible and its ash contents had been thoroughly cooled, their combined weight was carefully determined. The results were expressed as a percentage, calculated as the weight of the ash in relation to the initial weight of the sample, as described by Equation (1).
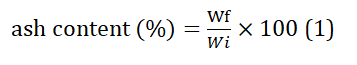
Where, Wi = Weight of original sample and Wf = weight of sample after drying.
Moisture content
This approach involved ascertaining the water percentage in a sample through a process of desiccation until the sample reached a consistent weight. To determine the moisture content of tea waste, a digital moisture analyzer was employed at a temperature of 105°C for duration of 30 minutes. For this analysis, three separate 1-gram samples were utilized, and their mean value was recorded. Additionally, the moisture content was assessed using the conventional oven-drying method, yielding identical results. These outcomes were quantified using Equation (2).
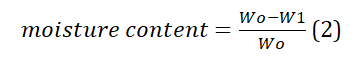
Where, wo = initial weight of dry sorbent, w1 = weight of sorbent after drying
Porosity
The tea waste's porosity was assessed by correlating it with the tea particle size. The porosity of the tea was determined through a straight forward visual examination of the data graph, utilizing the particle size range. This porosity measurement also serves to ascertain the active surface area of the adsorbent.
Particle size determination
A predetermined amount of tea waste was placed onto a sieve shaker equipped with various sieve sizes. Following the shaking or vibration process, the different sieves retained varying amounts of material, and this retained material was subsequently preserved for analysis.
Surface area
The surface area of the tea waste was determined in relation to its porosity and particle size, where the surface area represents the ratio of surface to volume for an individual tea waste particle, serving as a fundamental physical parameter for the adsorption capacity of the adsorbent. The calculation of the tea particle's surface area was performed using equation (3).
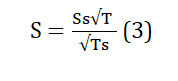
Where: Ss surface volume of the bed, constant value for tea=3974cm3. T= time determined for weighting the particle absorbs the fluid. Ts = time determined for dropping the fluid, constant value for tea =50.2sec. S = surface area of the particle.
Volatile matter determination
The initial step involved weighing an empty crucible. Subsequently, 1 gram of the sample was carefully placed into the crucible and reweighed. Following this, the crucible was subjected to a temperature of 600°C within a muffle furnace for a duration of 10 minutes. After the heating process, the crucible was removed and allowed to cool in a desiccator for half an hour. The weight of the sample inside the crucible was then measured once more. The percentage of volatile matter was subsequently determined using equation (4).
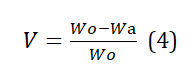
Where, Wo = initial weight of dry sorbent, Wa = weight of tea after cooling
Bulk Density determination
First, measure the mass of the Pycnometer. Next, fill the Pycnometer to 50% of its volume with the sample and record its weight. Then, fill the remaining volume with distilled water and calculate the bulk density.
Fourier Transformation Infrared Spectroscopy (FTIR)
FTIR analysis was conducted to identify the diverse functional groups present on the surface of tea waste material. The FTIR spectra were recorded using an FTIR instrument with potassium bromide (KBr) as the reference. Spectrophotometry was employed to capture the spectra in the spectral range of 400-4000 cm-1, following the method outlined by Ahmaruzzaman and Laxmi Gayatri in 2010 [22].
Preparation of copper stock solution
A stock solution of copper sulfate pentahydrate was created by dissolving 3.9 grams of the compound in 1 liter of distilled water. Various concentrations of solutions were subsequently derived from this stock solution, and these solutions were utilized in the preparation of a standard curve.
Full factorial design
The independent variables in this study encompass varying copper concentrations (10, 30, and 50 ppm), different residence times (60, 90, and 180 minutes), and pH levels (4, 5, and 6). The dependent variable, namely the percentage of copper removal, was assessed through a comprehensive fractional design, as depicted in Table 2.
Table 2: Full factorial deigns experimental methods.
|
Independent factors |
Factors level |
|
Concentration of copper |
Three (10ppm, 30ppm,50ppm) |
|
Contact time |
Three (60min,120min,180min) |
|
pH |
Three (4,5,6) |
|
No of run |
27 |
|
Replicate(two times) |
2*27=54 |
|
Total experiment |
54 |
|
Response |
%removal=((Co-Ce)/Co))*100 |
Heavy metal ion Adsorption procedure
A set of duplicate single-adsorbate experiments and competitive batch adsorption trials were carried out under controlled conditions at 30 degrees Celsius. These experiments were conducted in acid-washed polyethylene plastic bottles and included both blank experiments (involving only the adsorbent media) and control experiments (involving only the heavy metal ions). In each experiment, a 200 mL solution containing a known concentration of heavy metal ions and a specified dose of the adsorbent were agitated at 110 revolutions per minute on a horizontal shaker for a predetermined contact time. Afterwards, the adsorbent was separated through filtration using Whatman filter paper no.1. Subsequently, the concentration of heavy metal, specifically Copper in the filtrate, was analyzed using Atomic Absorption Spectrometers (AAS) at a wavelength of 324.8 nm. Duplicate measurements were performed, and the results were averaged for reporting.
Batch Mode Adsorption Experimental Studies
The adsorption of heavy metals onto tea waste was investigated through a batch technique. The general procedure for this study can be outlined as follows:
A predetermined amount of tea waste adsorbent, typically 1 gram, was brought to equilibrium with 200 millilitres of various heavy metal solutions, specifically copper (Cu), each having known concentrations of 10, 30, and 50 parts per million (ppm). This interaction took place in separate stoppered borosilicate glass flasks, all maintained at a constant temperature of 30 degrees Celsius. The flasks were placed on an orbital shaker for a specified duration, ranging from 60 to 180 minutes. At time intervals of 60, 120, and 180 minutes, 10 millilitres of the sample were withdrawn from each flask. To separate the adsorbent suspension from the solution, filtration was carried out using Whatman No.1 filter paper. Subsequently, the remaining concentration of heavy metal ions in the solution was determined using an Atomic Absorption Spectrometer (AAS). The study also examined the influence of various parameters on the adsorption process, including pH, initial metal concentrations, and contact time. The pH of the adsorptive solutions was adjusted as needed, using sulfuric acid, sodium hydroxide, and buffer solutions. The percentage of heavy metal removal was calculated using Equation (5).
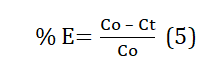
Where, Co: initial metal ion concentration of test solution, mg/l; Ct is heavy metal concentration [mg.l-1] at time t [min].
The equation (6) proposed by Argun et al. (2007) [23] can be used to estimate the amount of toxic heavy elements absorbed by locally available material, such as tea waste.
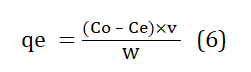
Where, qe the adsorption efficiency [mg. g-1], Co is amount of heavy metal before process [mg. l-1] Ce is equilibrium amount of heavy metal [mg. l-1], v is volume of waste water, and w is adsorbent weight [g].
Copper Concentration Analysis
Copper concentrations in the adsorbate were measured using an Atomic Absorption Spectrophotometer (Perkin Elmer 3100). Calibration curves were established through the aspiration of standard solutions containing known concentrations of Cu (II) into the flame, specifically, 10, 20, 30, 40, and 50 mg/l. The adsorption of each solution was recorded, and subsequent water samples were analyzed against this calibration curve. Distilled water was also used as a blank reagent before establishing the calibration curve and between sample analyses. A copper-specific hollow cathode lamp with a wavelength of 324.8 nm was employed in this process.
Adsorption isotherm
Adsorption isotherms serve as the primary means to represent both the concentration of the adsorbate and the quantity of material adsorbed. These isotherms are mathematical constructs that elucidate the distribution of adsorbate species within a liquid and an adsorbent. They are rooted in a series of assumptions, primarily focusing on the heterogeneity or homogeneity of the adsorbents, the nature of coverage, and the potential for interactions among adsorbate species.
To scrutinize adsorption isotherms, a study was conducted by fitting equilibrium data to two fundamental models: the Langmuir and Freundlich isotherm models. The validity of these isotherm equations in relation to the equilibrium data was elucidated by evaluating the correlation coefficients, denoted as R². Through regression analysis, it was determined that the closer the R² value is to unity, the more adept the model is in portraying the isotherm parameters.
RESULTS AND DISCUSSION
This chapter presents the results of laboratory analysis conducted to characterize tea waste and investigates the influence of various parameters, including pH, heavy metal concentration, and contact time, on the heavy metal removal capacity of tea waste when applied to constituent wastewater. The study involved treating wastewater containing heavy metals with tea waste and assessing the performance of tea waste by systematically varying these parameters to optimize its effectiveness in removing specific metal ions.
Treatment of Tea waste to remove heavy metal
Characterization of Tea waste (adsorbent)
Table 3: Physicochemical properties of tea waste.
|
Characteristics |
Present Value |
|
Ash content (%) |
2.99 |
|
Moisture content (%) |
4.91 |
|
Porosity (Nm) |
1.92 |
|
Particle size (Mm) |
50-80 |
|
Volatile matter (%) |
79.9 |
|
Particle size (g/cm3) |
50-80 |
The physicochemical composition of tea waste was thoroughly analyzed and the results are summarized in Table 3. As indicated in the table, the moisture content of the tea waste was relatively low, at 4.91%, suggesting that the adsorbent was well-prepared and handled. According to Aziza et al. (2008) [24], the moisture content is closely related to the porosity of the adsorbent. An adsorbent with higher moisture content tends to swell less, which in turn restricts the expansion of pore sizes for adsorbate uptake.
The study also revealed a volatile matter content of 79.9%, which plays a key role in decomposing organic materials, releasing volatiles, and facilitating the development of micro-porous structures, as observed by Malik et al. (2006) [25].
Ash content, a measure of inorganic impurities in the carbons, was found to be at a relatively low level, indicating favourable adsorbent characteristics, in alignment with the research of Bansode et al. (2003) [26].
Furthermore, the carbon content, representing the residual carbon present in the sample, was determined to be 70%. This aligns with the findings of Malik et al. (2006) [25], who noted that the carbon composition of adsorbents typically falls within the range of 50-90%.
It's important to note that the surface area of a material can vary depending on the activation method used, potentially affecting its adsorption properties.
A deeper comprehension of the adsorption mechanism of Cu2+ on tea waste can be achieved through a Fourier Transform Infrared (FTIR) analysis of tea waste prior to adsorption. Figures 3 (a & b) display the FTIR spectrum of the adsorbent, which reveals the intricate nature of the adsorbent through its numerous adsorption peaks.
The FTIR spectra recorded for tea waste before adsorption exhibits distinctive features: a sharp bend at 3429.4 cm-1 signifies the asymmetric stretching of the N-H group, confirming the presence of an amino group. The peak at 3333.0 cm-1 corresponds to the OH stretching of the COOH group, while the peak at 2970.4 cm-1 likely arises from the C-H normal mode. The band near 2630 cm-1 is attributed to the OH stretching of the COOH group, and a robust peak at 2904.8 cm-1 represents the C-H group. Additionally, the peak at 1726 cm-1 may be attributed to a carbonyl ester group, and the 1612 cm-1 peak is indicative of aromatic ring vibrations. Furthermore, the symmetric stretching of double bonds manifests as the 1502 cm-1 peak. These spectral characteristics collectively validate the adsorption of Cu2+.
The FTIR analysis of the spectra suggests that the adsorption of Cu2+ onto the tea waste surface can be attributed to the H-bonded O-H stretch, C-C=C symmetric stretch, and C-O stretch of esters.
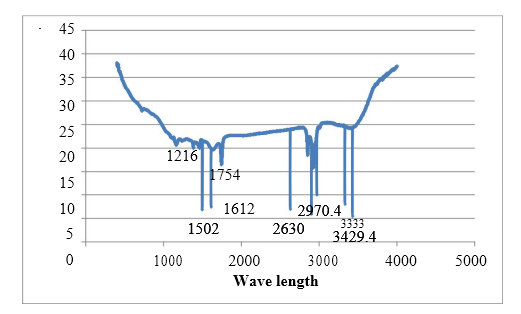
Figure 3 (a): FTIR Analysis of tea waste before adsorption.
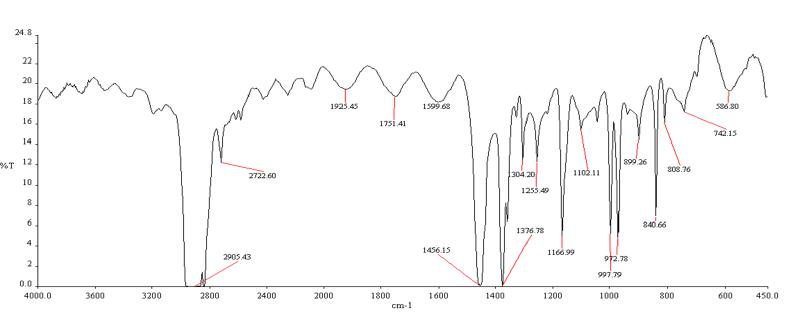
Figure 3(b): Comparison with another investigation of the FTIR of Activated carbon.
Variations in the chemical properties of reagents play a significant role in influencing the porosity development of adsorbents. Comparative adsorption data was gathered for various treatments on an adsorbent derived from char, including NaOH, ZnCl2, KOH, H3PO4, H2O2, and MnO2. The results are as follows (in mg•g-1): 26.73, 39.18, 78.63, 77.28, 94.60, 28.42, and 8.19, respectively (Ahmaruzzaman and Laxmi, 2010) [27]. These findings indicate that H3PO4 is the most effective activating agent for enhancing the adsorption of heavy metals from aqueous solutions. In the current study, H3PO4 soaked tea waste was employed as the adsorbent for the efficient removal of Cu2+ from wastewater.
Optimum Conditions for copper Removal by the Tea waste adsorbent
Effect of adsorbent dose
The results of the adsorbent dose study are presented in Figure 4. As the adsorbent dose increased from 0.4 to 1.0 g/200 ml, the removal efficiency exhibited a noticeable improvement, rising from 64.36% to 92.45%. This enhancement can be attributed to the greater availability of sorption sites for the interaction between the sorbent and solute. However, as the adsorbent dose was further increased from 1.0 to 2.0 g, the percentage of adsorption exhibited a less significant increase. Consequently, it was decided to maintain the adsorbent dose at 1.0 g for all subsequent experiments, as it was deemed sufficient for the effective removal of copper. The increase in adsorption with the adsorbent dose can be attributed to the expansion of the adsorbent's surface area and the increased availability of adsorption sites.
In certain instances, the amount of metal ions adsorbed per unit weight of adsorbent decreased with the increase in adsorbent dose. This phenomenon can be explained by the fact that at higher adsorbent doses, the solution's ion concentration decreases to a lower value, and the system reaches equilibrium at lower concentration levels, indicating that the adsorption sites remain unsaturated.
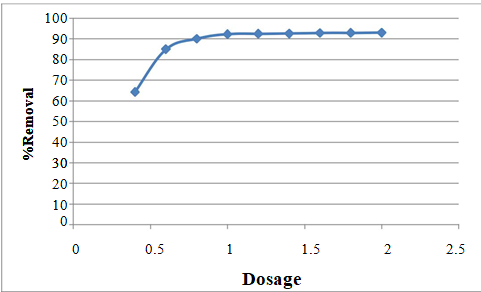
Figure 4: Effect of adsorbent dose on the % removal of copper (Co = 30ppm, pH = 3, agitation speed = 110 rpm and contact time = 3hr).
Effect of contact time
Figure 5 illustrates the impact of contact time on the removal of heavy metals using a 1g/200ml tea waste adsorbent at a pH of 5, with varying initial metal ion concentrations of 10ppm, 30ppm, and 50ppm. The highest percentage of copper ion removal, 95.98%, was achieved after 120 minutes when the initial concentration was 10ppm. To reach this point, the contact time was systematically varied between 60 minutes and 180 minutes in separate experimental trials.
As expected, the amount of Cu2+ ions adsorbed by the adsorbent increased over time, reaching a plateau where no further removal occurred. This equilibrium point represents a dynamic balance between ions being adsorbed onto and desorbed from the adsorbent. The time required to reach this equilibrium state is known as the equilibrium time, and the quantity of ions adsorbed at this time signifies the maximum adsorption capacity of the adsorbent under the given operating conditions. In all cases, equilibrium was attained at 120 minutes.
This can be explained by the initial rapid ion uptake, facilitated by the abundance of vacant adsorption sites and a high ion concentration. However, as adsorption sites became saturated, the uptake rate diminished, leading to the establishment of equilibrium.
.png)
Figure 5: Effect of contact time on % removal of cupper ion by Tea waste adsorbent at pH5
Effect of pH
Variations in pH play a crucial role in influencing the uptake of heavy metals from wastewater and aqueous solutions. As depicted in Figure 6, the impact of pH on the removal efficiencies of heavy metals by tea waste adsorbent is evident. These investigations were carried out using an initial concentration of metal ions set at 10, 30, and 50 ppm in a 200 ml solution. Additionally, a constant adsorbent dose of 1 g per 200 ml solution and an agitation period of 120 minutes were maintained for both heavy metal ions while varying the pH in each solution. It is evident that the percentage of adsorption increases with pH, reaching its maximum at pH 5, after which it decreases with further pH elevation. The highest removal efficiency at the optimal pH is approximately 95.98% for a 10-ppm initial copper concentration and 99.8% for metal removal from the solution.
This behaviour may be attributed to several factors. Below a pH of 4.0, the dominant electrostatic force of repulsion occurs between the adsorbent (tea waste) and the adsorbate (Cu2+). Conversely, at pH levels exceeding 6.0, there is a potential for adsorbate precipitation on the adsorbents' surface due to nucleation, as previously discussed (Agrawal et al., 2004) [28]. Higher pH values, specifically above the optimum pH of 5, lead to an increase in OH− ions, causing a decrease in the adsorption of metal ions at the adsorbent-adsorbate interface. The reduced solubility of hydrolyzed metal ions species also contributes to the maximum adsorption at pH 5. In the lower pH range, metals predominantly exist as metal ions in the adsorptive solution, resulting in a competition between H+ and metal ions M+ for adsorption at ion-exchangeable sites, leading to lower metal removal. Additionally, extensive repulsion of metal ions due to the protonation of the adsorbent surface in the lower pH range further decreases metal adsorption. The mechanism of metal ion adsorption may also be elucidated through an ion exchange model.
In carbon aerogel, carbon-oxygen complexes are described by Equations 7 (a&b). The hydrolysis of surface oxygen complexes with water molecules is illustrated as follows:
2COH + M+ → (CO)2 M+ + 2H+ (7a)
2COH2 + M+ → COM2+ + 2H+ (7b)
This demonstrates that the uptake of more metal ions results in the release of more H+ ions. The increase in metal removal with increasing pH can be attributed to reduced competition between protons and metal cations for the same functional groups and a decrease in positive surface charge, leading to lower electrostatic repulsion between the surface and the metal ions. Conversely, the decline in adsorption at higher pH values (above pH 5) is due to the formation of soluble hydroxyl complexes.
.png)
Figure 6: pH impact on the removal efficiencies of heavy metals by tea waste adsorbent.
Effect of initial concentration of heavy metal
The impact of initial ion concentrations on the adsorption efficiency of the tea waste material under study, under optimal conditions of pH 5, a contact time of 120 minutes, and agitation speed of 110 rpm, is illustrated in Figure 7. Various adsorption experiments were conducted across a range of initial ion concentrations, spanning from 10 ppm to 50 ppm. A consistent trend emerged, wherein the removal percentage decreased as the initial concentration of ions increased. This outcome can be attributed to the growing competition among ions for available binding sites and the diminished presence of active sites on the adsorbent at higher ion concentrations. Consequently, at higher concentration levels, a greater number of metal ions remained unadsorbed in the solution, as noted by Krishnan and Anirudhan in 2008 [29].
At lower initial ion concentrations, the ratio of active surface sites to the total metal ions in the solution is high, facilitating the interaction of all metal ions with the adsorbent, resulting in their removal from the solution. However, the amount of metal adsorbed per unit weight of the adsorbent (adsorption capacity) is greater at higher ion concentrations. At lower initial metal ion concentrations, there are enough adsorption sites available for the heavy metal ions. Consequently, the fractional adsorption remains independent of the initial metal ion concentration. Conversely, at higher concentrations, the heavy metal ions outnumber the available adsorption sites. Notably, the maximum removal percentage of copper ions reached 95.98% at a concentration of 10 ppm. Therefore, the removal percentage of heavy metals is contingent on the initial metal ion concentration and decreases as this concentration increases. The variation in the percentage removal of different heavy metal ions at the same initial metal ion concentration, adsorbent dose, and contact time can be attributed to differences in their chemical affinity and ion exchange capacity relative to the chemical functional groups on the adsorbent's surface.
.png)
Figure 7: Effect of concentration on the % removal of cupper at (pH = 5 agitation speed = 110 rpm and contact time = 2hr).
Combined effect of independent variables (concentration and pH) verses % removal
To explore the interplay between various independent variables and their impact on the response variable, contour plots were utilized. These plots offer a visual depiction of a three-dimensional response surface with respect to two independent variables while keeping all other variables constant or at varying levels. They prove valuable for comprehending both the primary and interacting influences of independent variables on the response variable. In Figure 8(a), we observe the interaction effect between the initial Cu2+ concentration and pH. Figure 8(b) presents a 3D plot illustrating this interaction. Notably, as the initial concentration decreases and the pH level increases, the removal percentage experiences a concurrent increase.
.png)
Figure 8 (a): Contour plots showing the combined effect of Cu2+ concentration and pH, at optimized adsorbent dose of 1g, shaking time 2hr.
.png)
Figure 8 (b): 3D plots showing the combined effect of Cu2+ concentration and pH, at optimized adsorbent dose of 1g, shaking time 2hr.
In broad terms, when the concentration of Cu2+ is higher, the percentage of removal tends to decrease as the pH decreases from 6 to 4. Conversely, at lower Cu2+ concentrations, removal tends to increase. These trends could be attributed to factors such as the state of the copper ions, the level of protonation, and the surface charge of the adsorbent material.
Combined Effects of concentration and time on %removal of Cu2+
Figure 9 (a & b) depicts the combined impact of concentration and time on the removal of Cu2+ by tea waste, as visualized through contour and 3D plots. The results obtained clearly indicate that as the contact time prolongs, the removal of metal ions intensifies, while concurrently reducing the initial concentration. These figures distinctly illustrate that removal efficiency rises as the contact time extends and concentration decreases, and conversely declines with an increase in concentration and a reduction in contact time.
.png)
Figure 9(a): Contour plots showing the combined effect of Cu2+ concentration and pH, at optimized adsorbent dose of 1g, shaking time 2hr.
.png)
Figure 9 (b): 3D plots showing the combined effect of Cu2+ concentration and time, at optimized adsorbent dose of 1g and at pH 5.
Development of Regression model analysis
Response Surface Methodology (RSM) was employed for statistical analysis to establish a well-fitted regression model for the adsorption process. For each adsorbate, specifically Cu2+, experimental data were subjected to fitting with linear, interactive, quadratic, and cubic models. The significance of the suggested regression models for each adsorbate was assessed using Analysis of Variance (ANOVA).
The findings in Table 4 indicated the efficacy of the copper treatment method utilizing tea waste. This effectiveness was observed at a concentration of 10 ppm, a pH of 5, and a contact time of 120 minutes. At these optimal conditions, the maximum removal efficiency for copper reached an impressive 95.98%.
Table 4: CCD design metrics for three variables and response value.
|
Run |
pH |
Time (min) |
Cu Conc.(ppm) |
% removal of Cu |
|
1. |
5 |
120 |
10 |
95.98 |
|
2. |
6 |
120 |
30 |
86.2 |
|
3. |
6 |
180 |
10 |
93.82 |
|
4. |
4 |
180 |
50 |
81.79 |
|
5. |
5 |
120 |
30 |
91.01 |
|
6. |
5 |
120 |
30 |
91.01 |
|
7. |
6 |
60 |
10 |
90.87 |
|
8. |
5 |
120 |
50 |
83.37 |
|
9. |
4 |
180 |
10 |
91.91 |
|
10. |
5 |
120 |
30 |
91.01 |
|
11. |
6 |
60 |
50 |
77.75 |
|
12. |
6 |
180 |
50 |
81.34 |
|
13. |
5 |
120 |
30 |
91.01 |
|
14. |
4 |
120 |
30 |
87.19 |
|
15. |
5 |
60 |
30 |
83.14 |
|
16. |
5 |
120 |
30 |
91.01 |
|
17. |
5 |
120 |
30 |
91.01 |
|
18. |
4 |
60 |
10 |
89.88 |
|
19. |
4 |
60 |
50 |
80 |
|
20. |
5 |
180 |
30 |
88.2 |
Optimization of Cu2+ adsorption (Analysis of variance)
The Model F-value of 103.57 signifies the model's significance. There is an exceedingly low probability of only 0.01% that such a substantial "Model F-Value" could arise from random noise. When "Prob> F" values fall below 0.0500, it indicates the significance of model terms. In this instance, terms A, B, C, AB, and BC are all significant. Conversely, values exceeding 0.1000 suggest that the model terms lack significance. If your model contains numerous insignificant terms, excluding those essential for hierarchy, reducing the model may enhance its performance.
Table 5: ANOVA results of the regression model for optimization of Cu2+ adsorption.
|
ANOVA for selected Factorial Model |
||||||
|
Analysis of variance table [Classical sum of squares - Type II] |
||||||
|
Source |
Sum of |
df |
Mean |
F |
p-value |
|
|
Squares |
Square |
Value |
Prob> F |
|||
|
Model |
741.17 |
18 |
41.18 |
103.57 |
< 0.0001 |
Significant |
|
pH |
27.19 |
2 |
13.59 |
34.19 |
0.0001 |
Significant |
|
Time |
77.79 |
2 |
38.89 |
97.83 |
< 0.0001 |
Significant |
|
Cons |
615 |
2 |
307.5 |
773.43 |
< 0.0001 |
Significant |
|
AB |
6.81 |
4 |
1.7 |
4.28 |
0.0003 |
Significant |
|
AC |
6.09 |
4 |
1.52 |
3.83 |
0.00502 |
Significant |
|
BC |
8.3 |
4 |
2.07 |
5.22 |
0.00029 |
Significant |
|
Residual |
3.18 |
8 |
0.4 |
-- |
-- |
|
|
Total |
744.35 |
26 |
-- |
-- |
-- |
|
Evaluation of Adsorption capacity of tea waste
The driving force behind adsorption is the disparity in concentration between the solute present on the sorbent and the solute within the solution. A substantial concentration difference results in a strong impetus for the adsorption process. This phenomenon may elucidate the reason for the higher adsorption capacities observed in the column supplied with a greater Cu2+ concentration. When the initial copper concentration is raised from 10 ppm to 50 ppm, while maintaining all other experimental conditions constant, it is evident that the adsorption bed capacity increases from 1.9 to 8.34 mg/g and 1.996 to 8.4 mg/g, respectively. This rise in initial copper concentration leads to a more rapid breakthrough. Conversely, a decrease in the initial copper concentration yields delayed breakthrough curves due to the lower concentration gradient, resulting in slower transport, primarily attributed to a reduced diffusion coefficient (Aksu, 2005) [30].
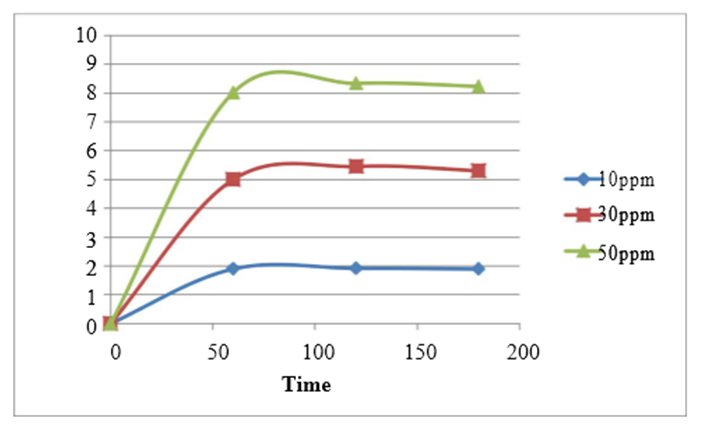
Figure 10: Adsorption capacity of tea waste at different concentration for copper at 1g/200ml of dosage and 5pH.
Adsorption Isotherm
Langmuir isotherm: Table 6 provides a summary of the Langmuir parameters' values and the correlation coefficients (RL). The fundamental attributes of the Langmuir isotherm can be represented in relation to a dimensionless equilibrium parameter (RL), as per the formula proposed by Weber and Chakkravorti in 1974 [31].
Where; KL is the Langmuir constant, Co is the highest metal concentration (mg.L-1). The value of RL indicates the type of the isotherm to be either unfavorable RL> 1, linear RL = 1, favorable 0 < RL< 1 or irreversible RL = 0 (Fytianos et al., 2003) [32]. Values of RL are summarized in Table (6).
Table 6: Values of RL for removal of copper ions.
|
Conc. ( ppm) |
RL for Cu2+ |
|
10 |
0.167 |
|
30 |
0.06297 |
|
50 |
0.04 |
Value of RL obtained are between 0 and 1 indicating the adsorbents prepared are favorable for adsorption of the metal ions under conditions used in the study.
Freundlich model:
The slope, denoted as 1/n and ranging from 0 to 1, serves as a metric for assessing adsorption intensity and surface heterogeneity. As this value approaches zero, it signifies an increasing level of surface heterogeneity (Haghseresht and Lu, 1998) [33]. A 1/n value below one corresponds to a standard Langmuir isotherm, while a 1/n value exceeding one suggests cooperative adsorption (Fytianos et al., 2003) [32]. For copper, the 1/n values were measured at 0.4922. This finding indicates that the adsorbents prepared in the study are well-suited for the adsorption of metal ions under the study's specified conditions, given that the 1/n value falls within the 0 to 1 range.
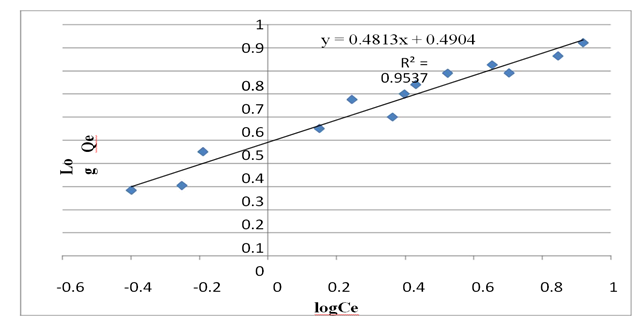
Figure 11: Freundlich plot for copper adsorption at PH 5.
Table 7: Isotherms parameter of copper removal by tea waste adsorbent.
|
Isothermal |
Parameter |
Copper |
|
Model |
|
|
|
Langmuir |
Adsorption constant(kL) |
0.496 |
|
Correlation coefficient(R2) |
0.981 |
|
|
Adsorption capacity(Qmax) |
8.34 |
|
|
Freundlich |
Adsorption intensity(i/n) |
0.4922 |
|
Adsorption capacity kF |
3.11 |
|
|
Correlation coefficient(R2) |
0.9537 |
It is evident from table 7 that the adsorption of Cu ions onto tea waste, fitted better to the Langmuir model R2 value (0.981) than Freundlich model under the same conditions.
3.6.3 Better-fit Isotherm models: As can be seen from Table: 7, the adsorption of Cu2+ ions onto tea waste, fitted better to the Langmuir model R2 value (0.981) than Freundlich model under the same conditions.
CONCLUSIONS
This study successfully prepared cost-effective adsorbents from tea waste and investigated their efficacy in removing recalcitrant compounds from synthetic wastewater. Additionally, the study employed response surface methodology to explore the interactive effects of operational parameters, including adsorbent dosage, initial concentration, solution pH, and adsorbent amount. The findings suggest that tea waste can serve as an affordable and efficient adsorbent for removing copper ions from wastewater. The experimental results revealed that under optimal conditions (pH 5, 120 minutes of contact time, 1g of adsorbent per 200ml of solution, and an initial concentration of 10ppm), tea waste achieved an impressive copper ion removal efficiency of 95.98%. These experimental investigations on adsorbents hold significant promise for the development of appropriate technologies aimed at removing heavy metal ions from contaminated industrial effluents.
Recommendations
The results obtained from the tea waste adsorbent demonstrate its efficacy in removing copper ions from aqueous solutions. Consequently, the following recommendations stem from the findings of this study:
1. Utilize tea waste as an economical and abundant resource for the cost-effective removal of heavy metals from wastewater. It presents a viable alternative to more expensive materials.
2. Investigate the adsorbent's capacity to simultaneously capture copper along with other toxic heavy metals such as cadmium, lead, and mercury.
3. Explore the adsorbent's selectivity with respect to specific ions, and analyze its potential for selective removal of contaminants.
4. Consider conducting research on the adsorbent's effectiveness in removing other toxic waste substances, including certain food dyes or colorants.
5. Enhance the removal efficiency of the tea waste adsorbent through continuous column experiments, and explore methods to immobilize the adsorbent on materials to facilitate its recovery and reuse.
REFERENCES
- Ideriah TJK, David OD, Ogbonna DN. (2012). Removal of heavy metal ions in aqueous solutions using palm fruit fibre as adsorbent. J Envir Chem Ecotoxicol. 4: 82-90.
- Akhtar N, Syakir Ishak MI, Bhawani SA, Umar K. (2021). Various natural and anthropogenic factors responsible for water quality degradation: A review. Water. 13(19):26-60.
- Ali H, Khan E, Ilahi I. (2019). Environmental chemistry and ecotoxicology of hazardous heavy metals: environmental persistence, toxicity, and bioaccumulation. J Chem. 1-14.
- Benhima H, Chiban M, Sinan F, Seta P, Persin M. (2008). Removal of lead and cadmium ions from aqueous sodium by adsorption onto micro-particles of dry plants. Colloids Surf. B: Biointerfaces. 61:10-16.
- (Davies et al., 2006)
- Balali-Mood M, Naseri K, Tahergorabi Z, Khazdair MR, Sadeghi M. (2021). Toxic mechanisms of five heavy metals: mercury, lead, chromium, cadmium, and arsenic. Frontiers in Pharmacol. 2(27):1-19.
- Rau UN, Amit P. (2002). Health hazards and Heavy metals. Int Society Envir Botany. 8: 1-5.
- Reena S, Gautam N, Mishra A, Gupta R. (2011). Heavy metals and living systems: An overview. Indian J Pharmacol. 43(3):246.
- Ogwuegbu MOC, Muhanga W. (2005). Investigation of lead concentration in the blood of people in the copper belt province of Zambia. J Envir. 1:66-75.
- Salman MA, Mohamed RM. (2013). Removal of antimony (III) by multi-walled carbon nanotubes from model solution and environmental samples. Chem Engineering Res Design. 91(7):1352-1360.
- Hadmohammadi MR, Salary M, Biparva P. (2011). Removal of Cr (VI) from aqueous solution using pine needles powder as a biosorbent. J Appl Sci Envir Sanitation. 6:1-13.
- Wasewar KL, Mohammad A, Prasad B, Mishra IM. (2008). Adsorption of Zn using factory tea waste: kinetics, equilibrium and thermodynamics. CLEAN: Soil, Water, Air. 36:320-329.
- FAO. (2009). Statistics Division.
- Wasewar KL. (2010). Adsorption of metals onto tea factory waste: a review. Int J Recent Res Appl Stud. 3:303-322.
- Arvanitoyannis IS, Varzakas TH. (2008). Vegetable waste treatment: comparison and critical presentation of methodologies. Critical Rev Food Sci Nutri. 48(3):205-247.
- Aikpokpodion PE, Ipinmoroti RR, Omotoso SM. (2010). Bisorption of Nickel (II) from aqueous solution using waste tea (Camella cinencis) materials. American-Eurasian J Toxicol Sci. 2:72-82.
- Habib MAB, Parvin M, Zannat MN. (2007). Two important techniques for isolation of microalgae. Asian Fisheries Sci. 20(1/2):117.
- Nandan A, Rangabhashiyam S. (2023). Reuse of water treatment plant sludge for treatment of pollutants. In Resource Recovery in Drinking Water Treatment:187-203.
- Azmat R, Akhter H. (2010). Changes in some biophysical and biochemical parameters of mungbean [Vigna radiata (L.) wilczek] grown on chromium-contaminated soils treated with solid tea wastage. Pak J Bot. 42(5):3065-3071.
- Hasar H, Cuci Y. (2000). Removal of Cr (VI), Cd (II) and Cu (II) by activated carbon prepared from almond husk. Envir Technol. 21: 1337- 1342.
- Mahavi AH, Naghipour D, Vaezi F, Nazmara S. (2005).Tea waste as an adsorbent for heavy metal removal from industrial wastewater. Am J Appl Sci. 2: 372-375.
- Ahmaruzzaman M, LaxmiGayatri S. (2010). Potential Low-Cost Adsorbent for the Removal of p-Nitrophenol from Wastewater. J Chem Engineering. 55:4614–4623.
- Argun ME, Dursun S, Ozdemir C, Karatas M. (2007). Heavy metal adsorption by modified oak sawdust: Thermodynamics and kinetics. J Hazardous Mat. 141:77-85.
- Aziza A, Odiakosa A, Nwajei G, Orodu V. (2008). Modification and Characterization of Activated Carbon Derived from Sawdust. Conference Proceeding, CSN Delta. Chem. 4:235-243.
- Malik R, Ramteke D, Water S. (2006). Physico-chemical and surface characterization of adsorbent prepared from groundnut shell by ZnCl2 activation and its ability to adsorb colour. Indian J Chem Technol. 13: 329-333.
- Bansode RR, Losso JN, Marshall WE, Rao RM, Portier RJ. (2003). Adsorption Of Volatile Organic Compounds By Pecan Shell And Almond Shell Based Granular Activated Carbons. Bioresource Technol. 90:175-184.
- Ahmaruzzaman M, Gayatri SL. (2010). Batch adsorption of 4-nitrophenol by acid activated jute stick char: equilibrium, kinetic and thermodynamic studies. Chem Engineering J. 158(2):173-180.
- Agrawal A, Sahu K, Pandey B. (2004). A comparative adsorption study of copper on various industrial solid wastes. AIChE J. 50:2430-2438.
- Krishnan KA, Anirudhan TS. (2008). Kinetic and equilibrium modeling of cobalt(II) adsorption onto bagasse pith sulphurised activated carbon. Chem Engineering J.137: 257-264.
- Aksu Z. (2005). Application of biosorption for the removal of organic pollutants: a review. Process Biochem. 40: 997-1026.
- Weber TW, Chakravorti RK. (1974). Pore and solid diffusion models for fixed‐bed adsorbers. AIChE J Am Institute Chem Engineers. 20(2):228-238.
- Fytianos K, Voudrias E, Kokkalis E. (2003). Sorption – desorption behavior of 2, 4 -dichlorophenol by marine sediments. Chemosph. 40: 3–6.
- Ho YS, Chiu WT, Wang CC. (2005). Regression analysis for the sorption isotherms of basic dyes on sugarcane dust. Bioresource Technol. 96(11):1285-1291.